
The 2022 UK CEO Value Index
For the 2023 version - click here
2022 offered the London Team which typically creates this unique CEO Value Index some unique challenges. Not only did we lose our Queen, we also saw several Prime Ministers moving out of No. 10, Downing Street. Also The London Team completed the transaction to complete a buyout of our international operations, from our previous firm.
Remuneration Associates was formed from that buyout in June 2022, and we are very excited about the future.
We have been busy!
The creation of each year’s Index requires the dedicated work of a selection of our highly experienced team and this year - as in every year of publication since 2012 - we had to fit in the work required to complete our analysis around our not inconsiderable client commitments.
As a result, this year’s publication is coming to you at the very end of 2022, a few months after we would typically have made it available (or published it in The Sunday Times).
The great strength of the Index is that such a delay does not matter because of the remarkable consistency or our findings. The analysis is sufficiently robust that it offers the calibration needed by any Remuneration Committee, irrespective of their sector or the size of their company. In certain cases, where share values dramatically fell some months after the close of our chosen 4-year period (as was the case with Just Eat, for example) the conclusions drawn for a single company may appear ‘out-of-date’. Importantly, that has no bearing on the value of the Index, which can be used in several important ways:
- As a benchmark to compare and contrast the performance calibration of senior executive incentive pay programmes – either in real time, historically or on a forward-looking basis. We have clients that have requested information to cover all such scenarios, and we would be happy to help you do the same;
- As a source of insight, based on a unique view of executive pay – each year the CEO Value Index offers the opportunity for unique analysis
- As an objective and unbiased historical record of the relationship between CEO pay and performance amongst the largest and most successful companies in the world.
We look forward to hearing from you.
Simon Patterson
Managing Director
Remuneration Associates
+44 203 384 6712
info@remunerationassociates.com
Introduction
Published annually since 2012, the CEO Value Index aims to provide a unique insight into pay-for-performance. Our database allows us to understand how Remuneration Committees invest in their top executives, and the lessons learned – on pay levels, and performance levels.
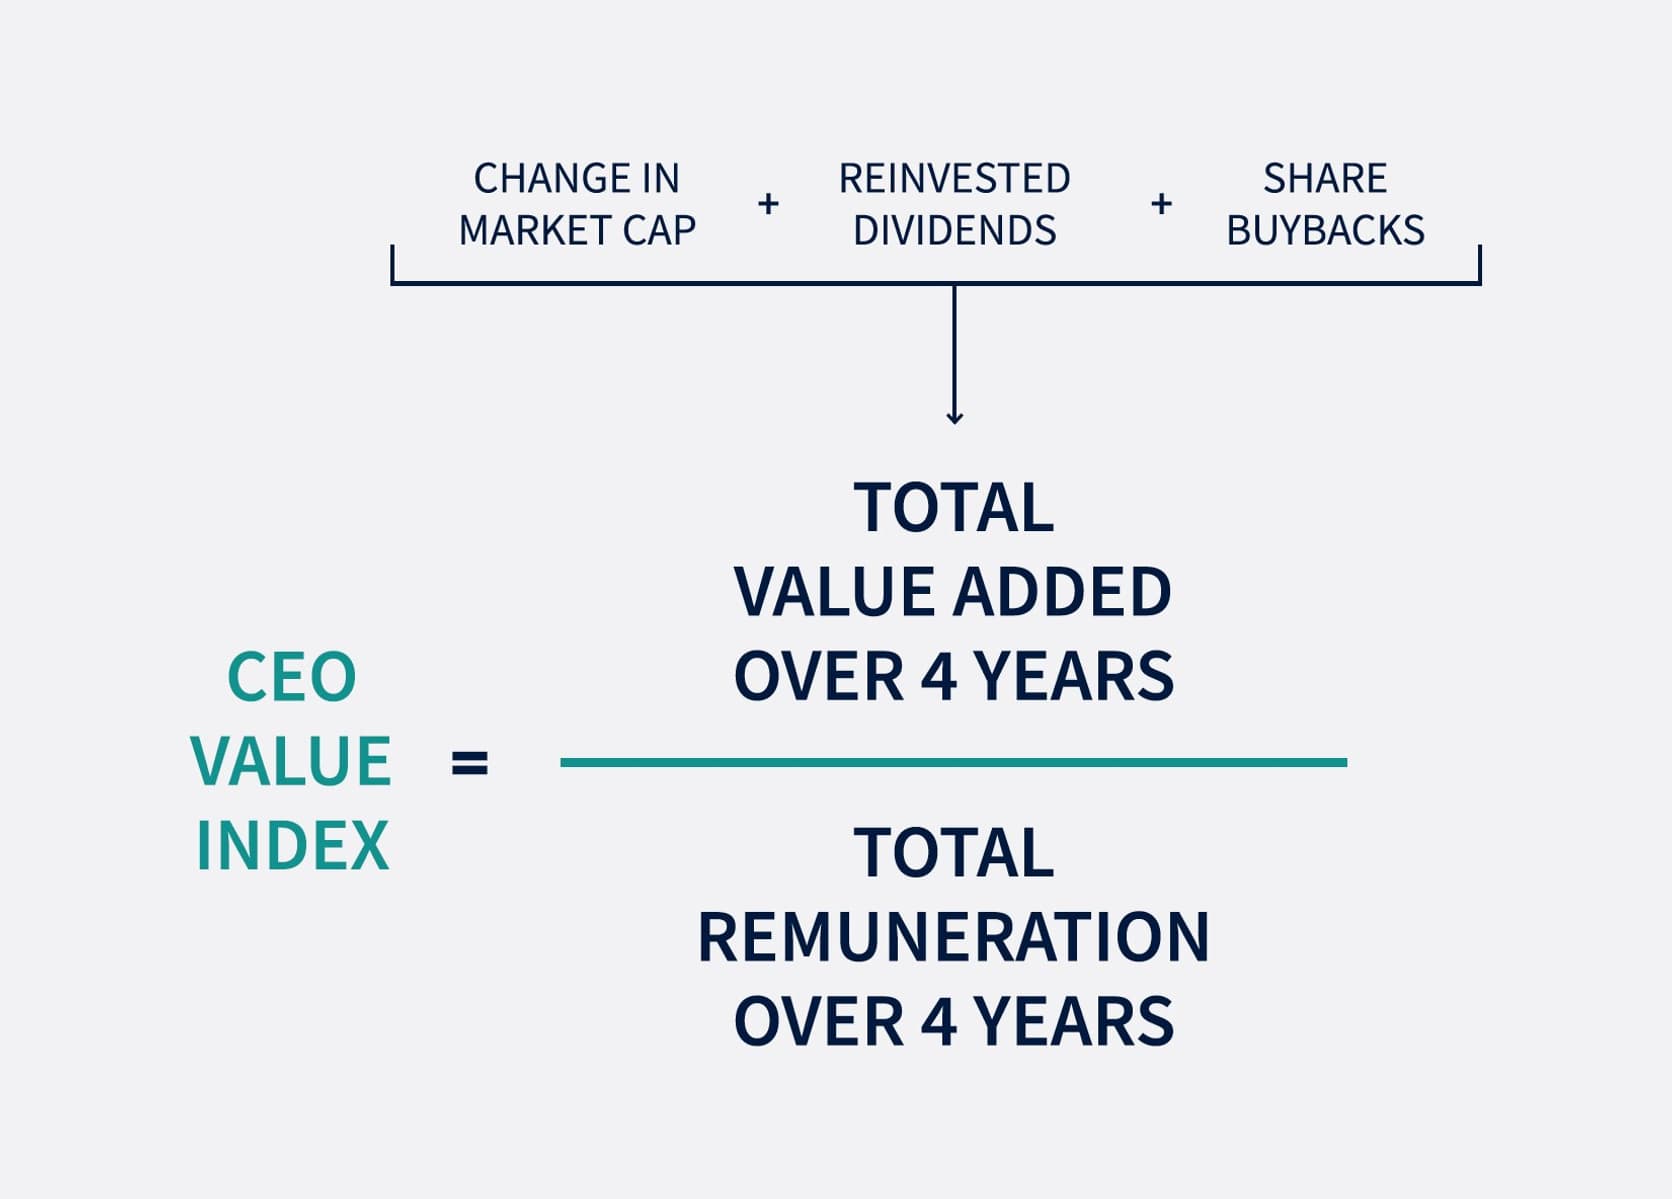
As a reminder: the CEO Value Index measures how much value a CEO adds to a company for every pound or dollar they are paid. The Index is a sophisticated methodology, but simple to understand. It can easily be applied by Remuneration Committees to their own decision-making.
Download The 2022 CEO Value Index
Total Remuneration and Total Value Added are calculated over a four year period. In the case of the 2022 Index that is from beginning 2018 through to the end of 2021.
Over the following page we take a brief look at some of this year’s key findings. If you would like to learn more about the Index or request a tailored report for your company then please don’t hesitate to get in touch with us at info@remunerationassociates.com
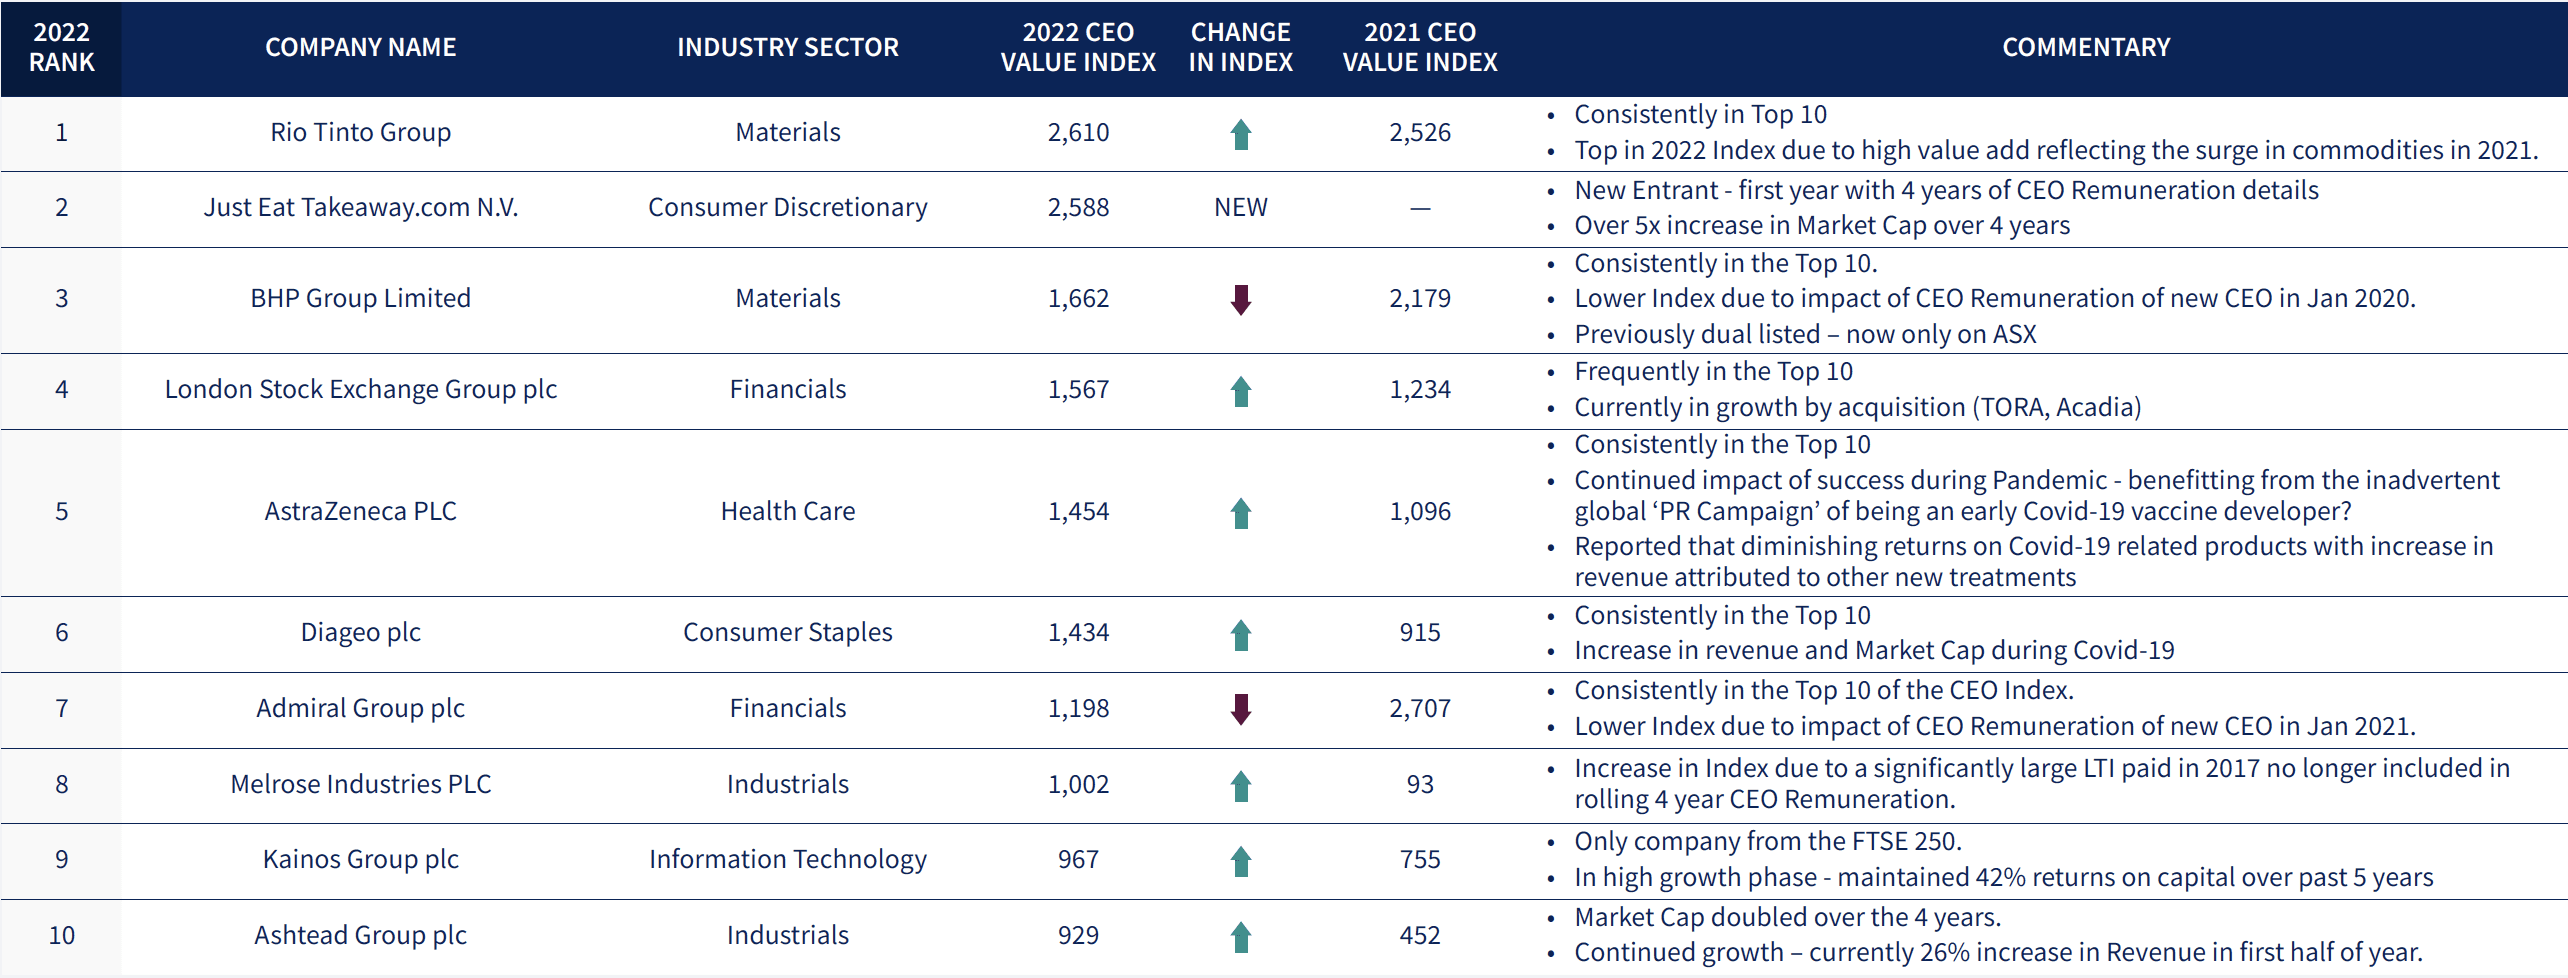
2022 CEO Value Index Top 10
The 2022 CEO Value Index reviewed the FTSE 100 companies as defined at 30th June 2021. Of those reviewed, 28% lost value over the period and 3% delivered more than £1,000 for every £1 paid to the CEO.
The following table shows the top performers of the 2022 Index period, i.e. the companies with the highest CEO Value Index, ‘the best value CEOs’
Which Companies are included in the CEO Value Index
Not all listed companies are eligible for the CEO Value Index (see exclusion list below). As shown in the graph below [Fig.1] 95% of FTSE 100 and 57% of the FTSE 250 were included in the CEO Value Index calculation (238). Of this number, 28% (66) had a negative Value Add. Therefore, a total of 49% of the FTSE 350 (172) companies, were included in the CEO Value Index rankings and analysis.
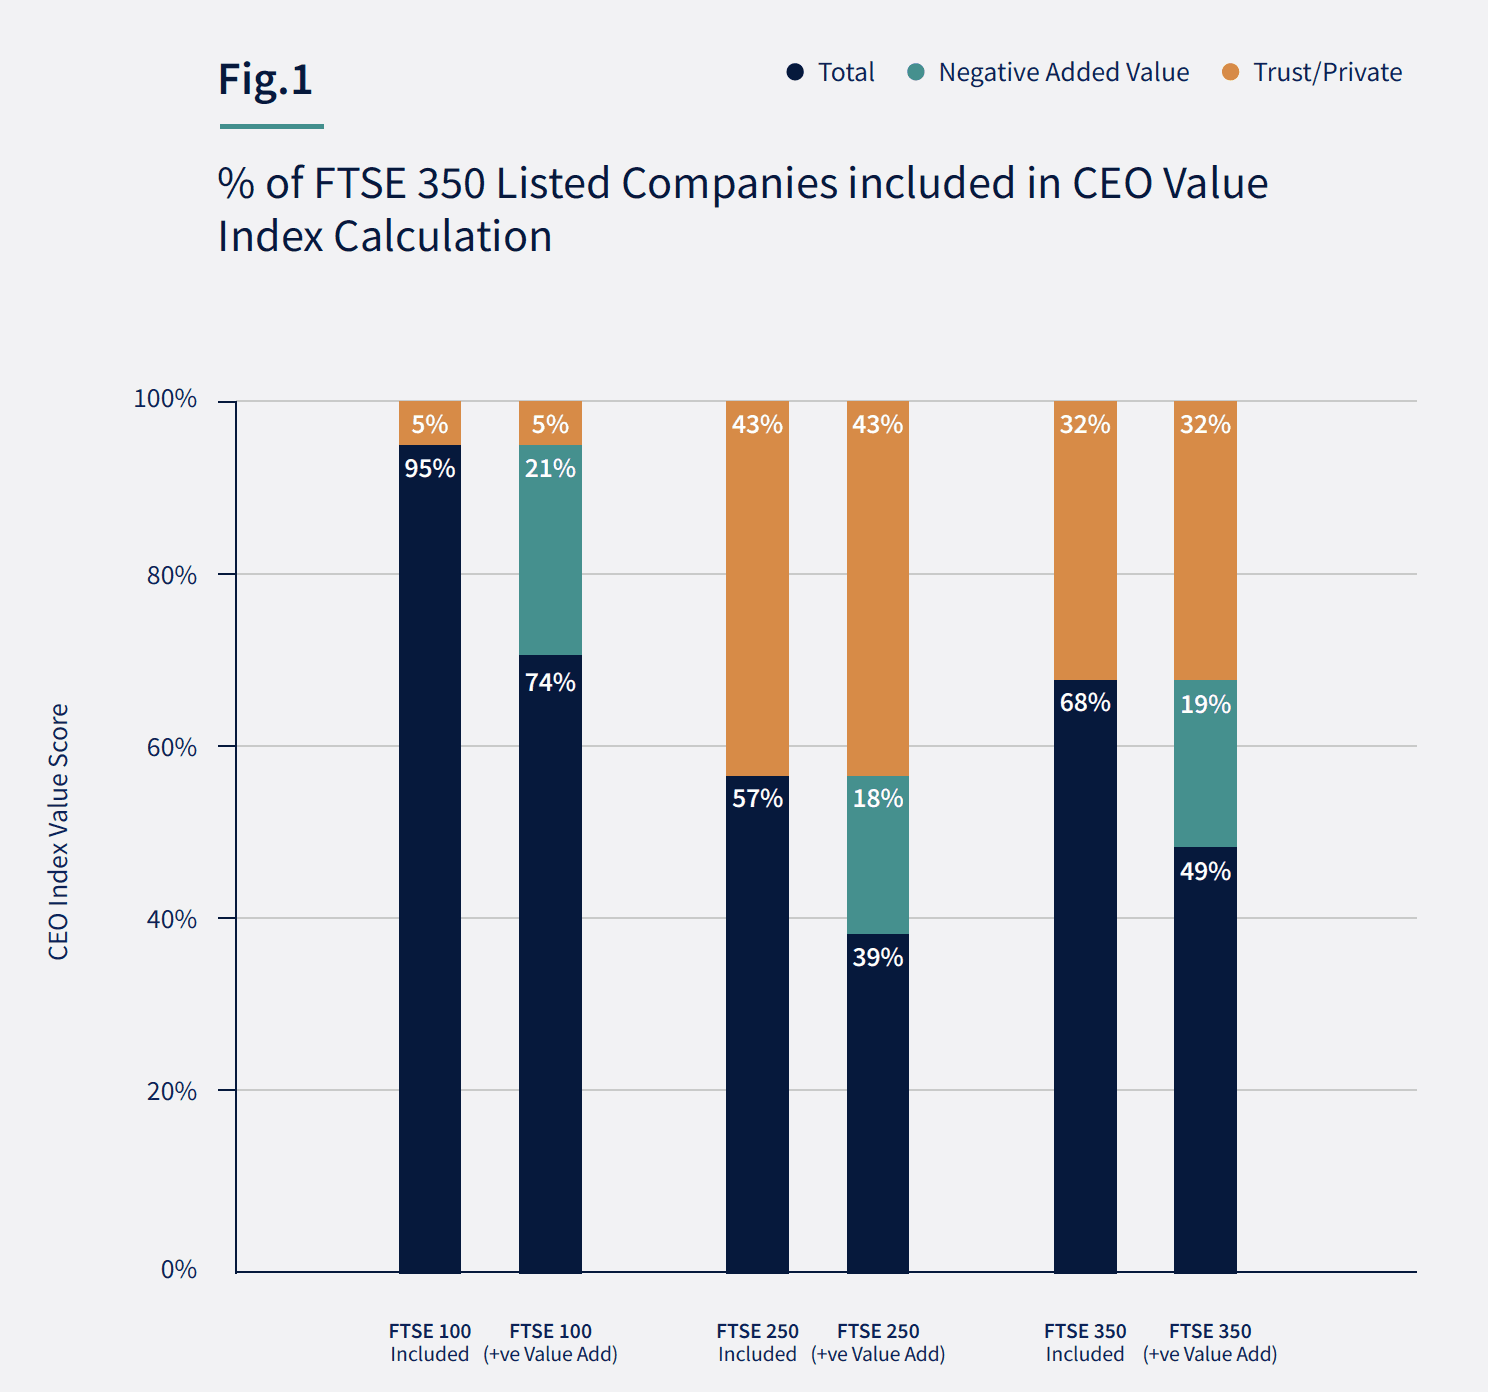
Exclusions:
The CEO Value Index cannot be calculated for companies if they are a Trust, recently Private, recently acquired, newly public (less than 4 years) and/or have no publicly disclosed CEO remuneration data.
Listed Companies by Industry Sector
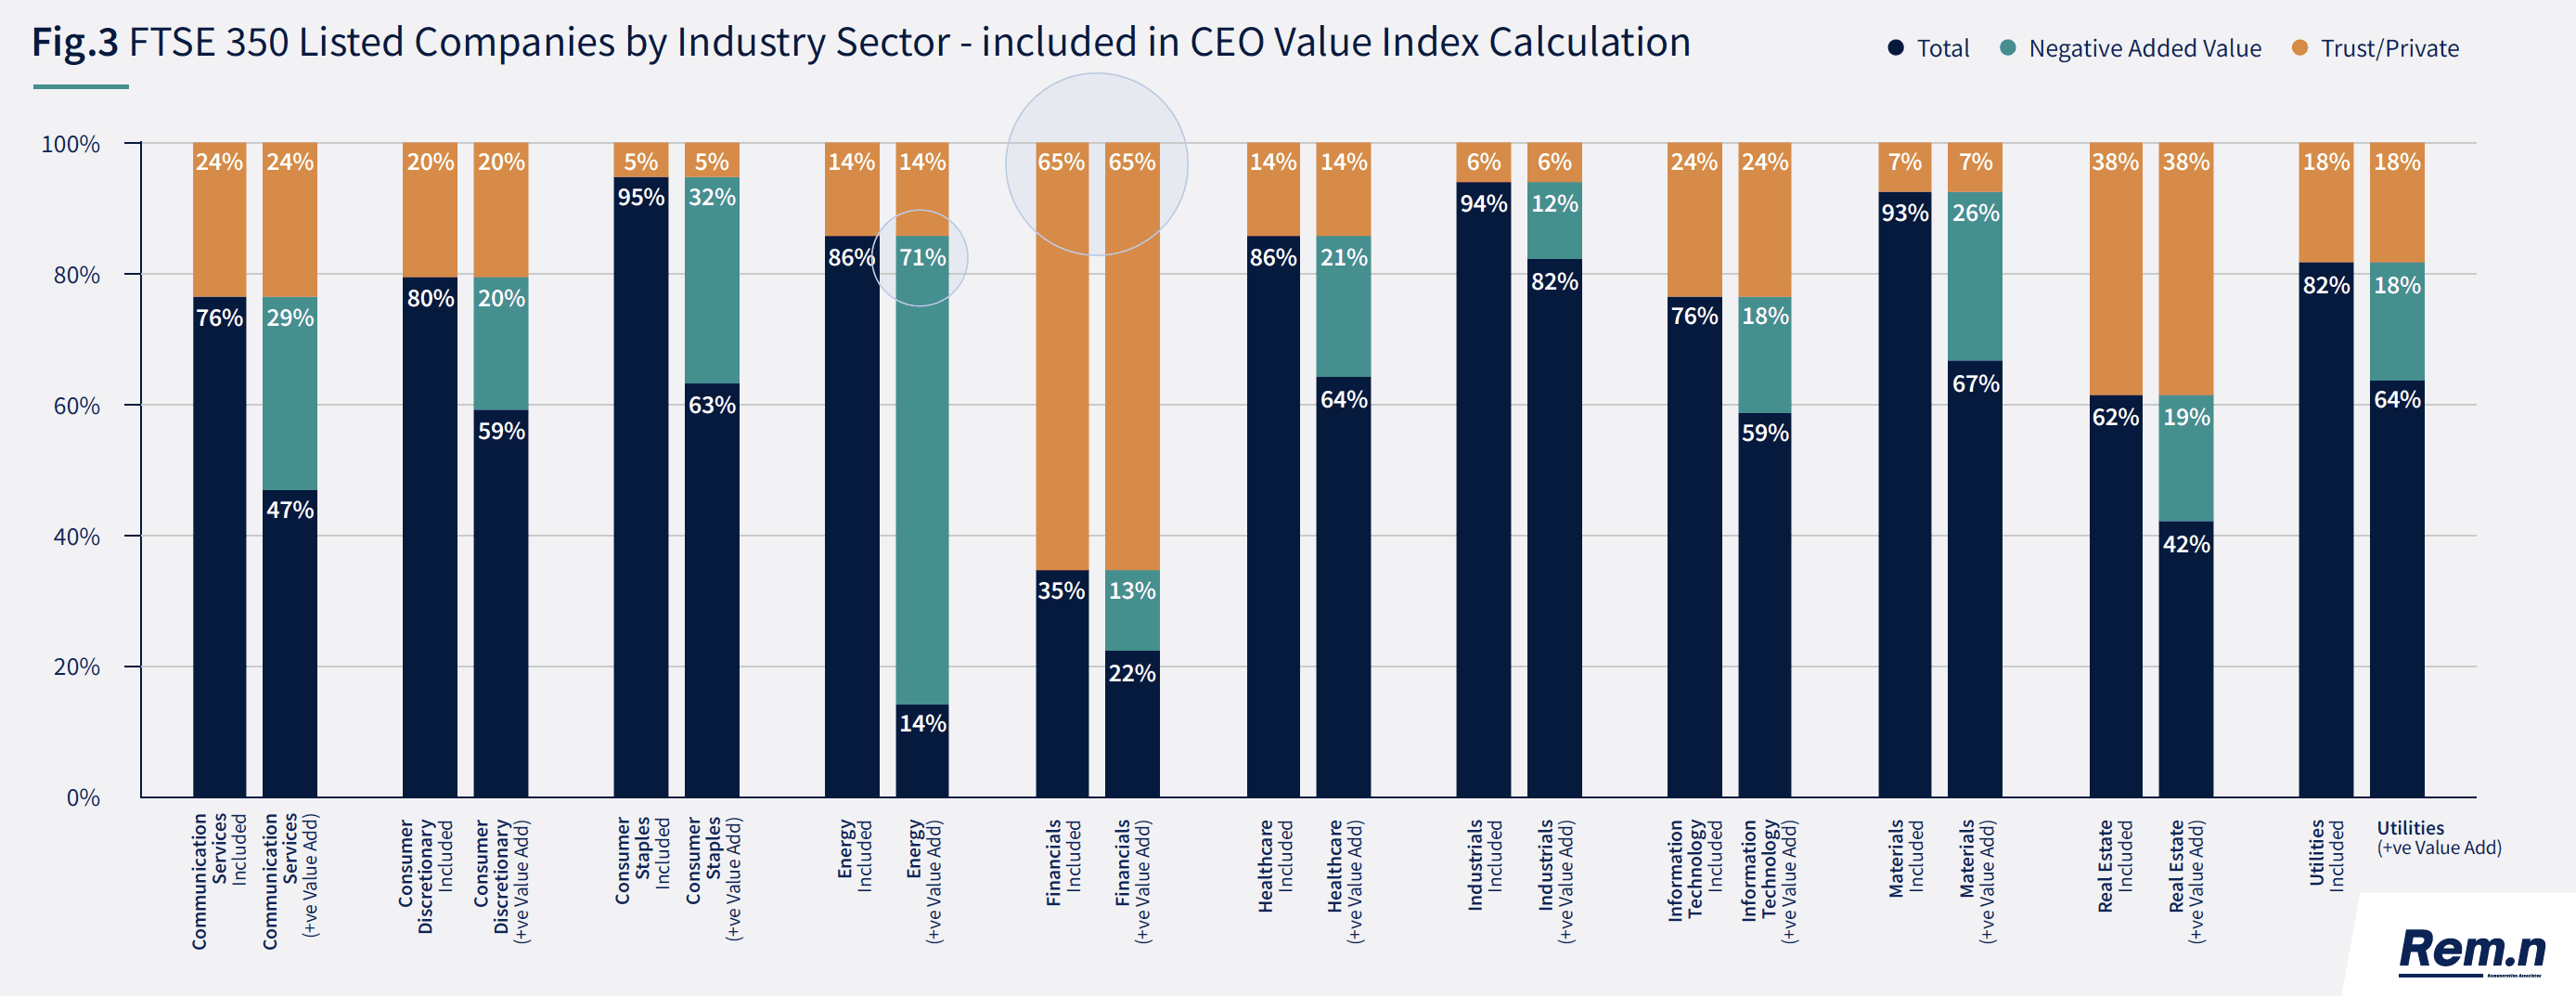
The graphs following show the split of the FTSE 350 by Industry [Fig. 2] and also the proportion of companies within each sector that are excluded from the CEO Value Index as well as those who have negative Value Add (and hence no Index score) [Fig.3]. The top Sectors represented within the FTSE 350 are Financials, Industrials and Consumer Discretionary.
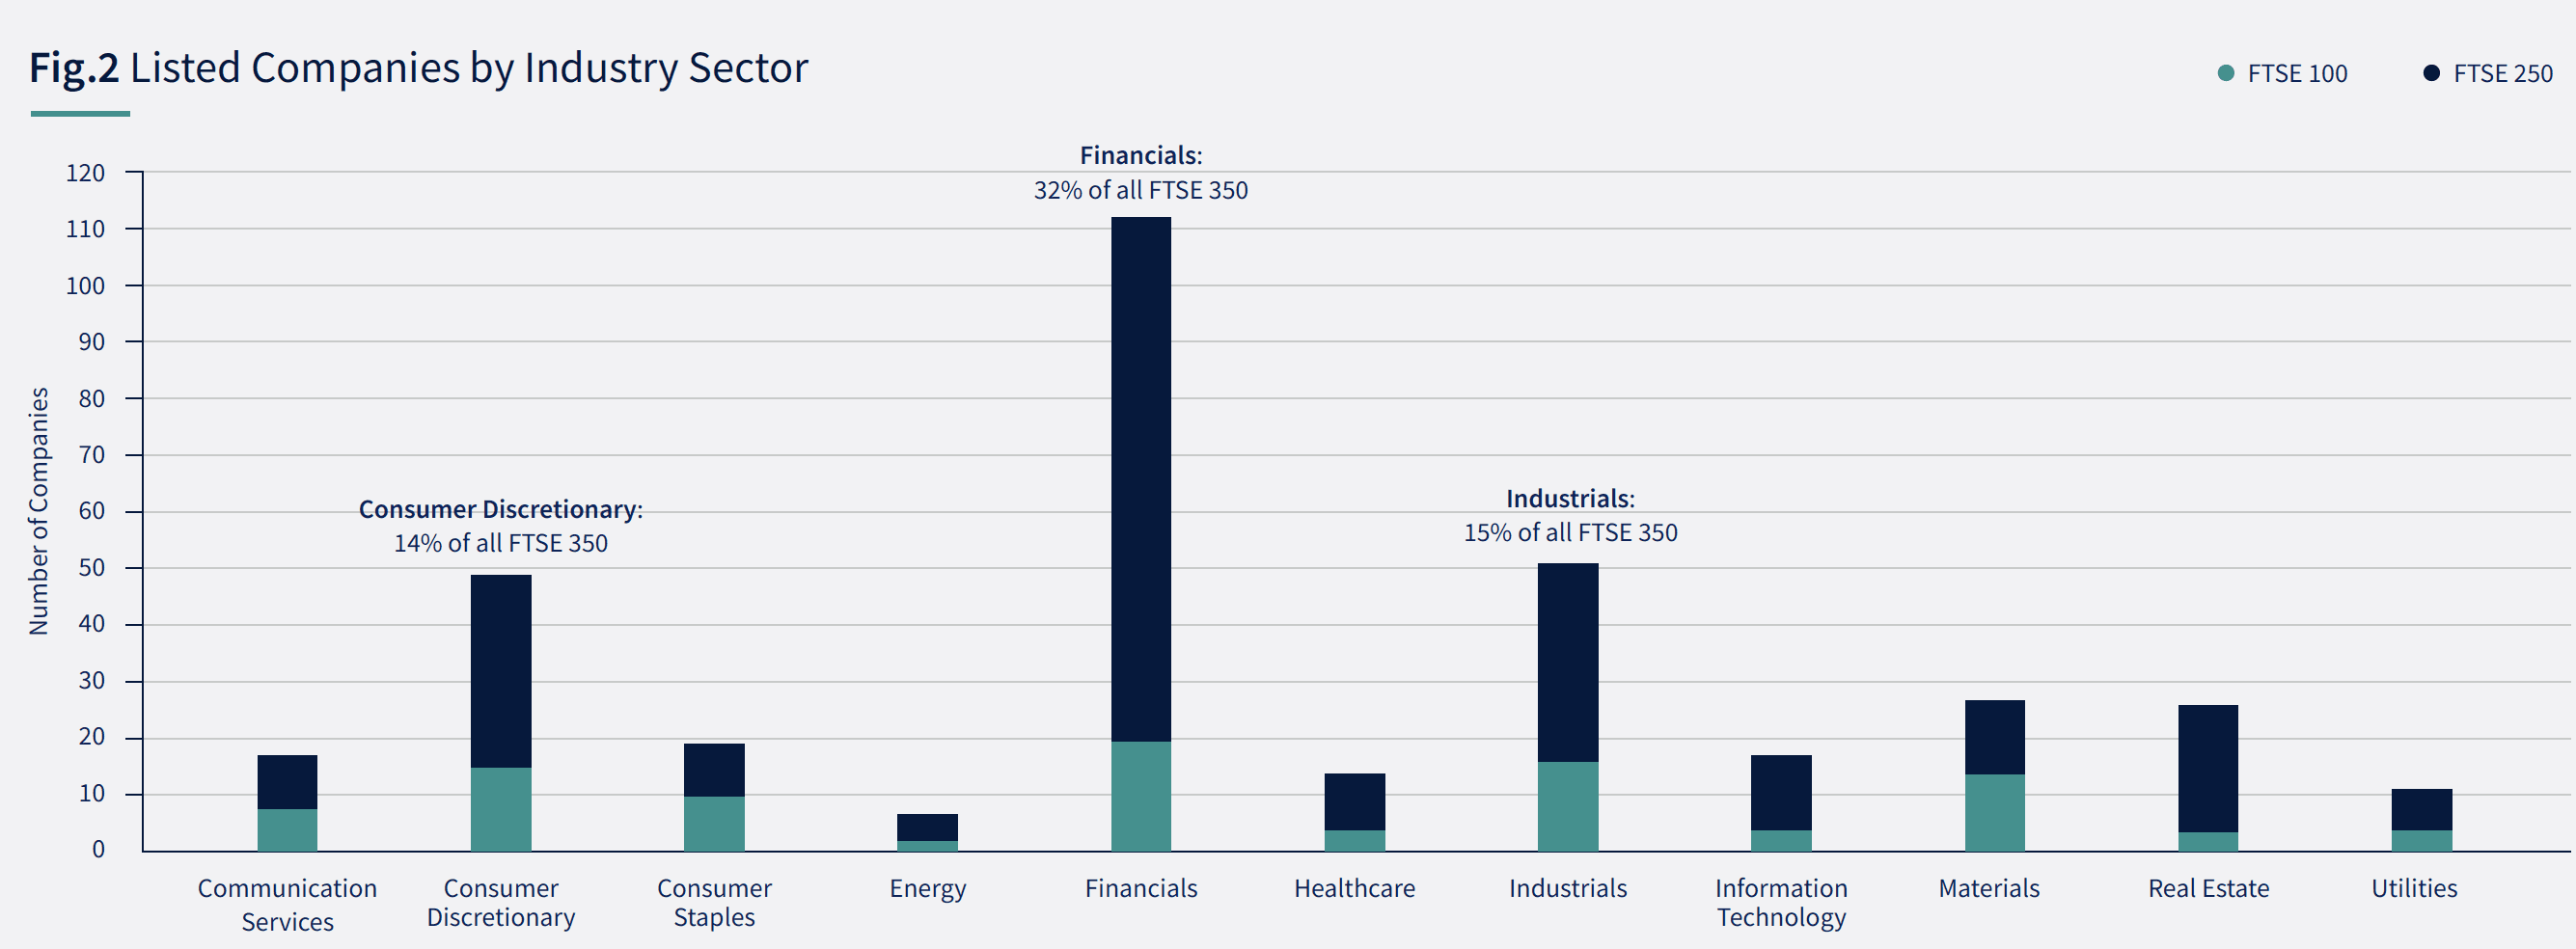
It is interesting to note that although Financials is by far the largest Industry sector [Fig.2] within the FTSE 350 (32%) – FTSE 100 (20%), FTSE 250 (37%) – it also has the largest proportion (65%) of companies excluded from the CEO Value Index calculation with the majority being Trusts (56%) [Fig.3]. Also, 71% of all the Energy companies had negative Value Add.
2022 CEO Value Index - FTSE 100
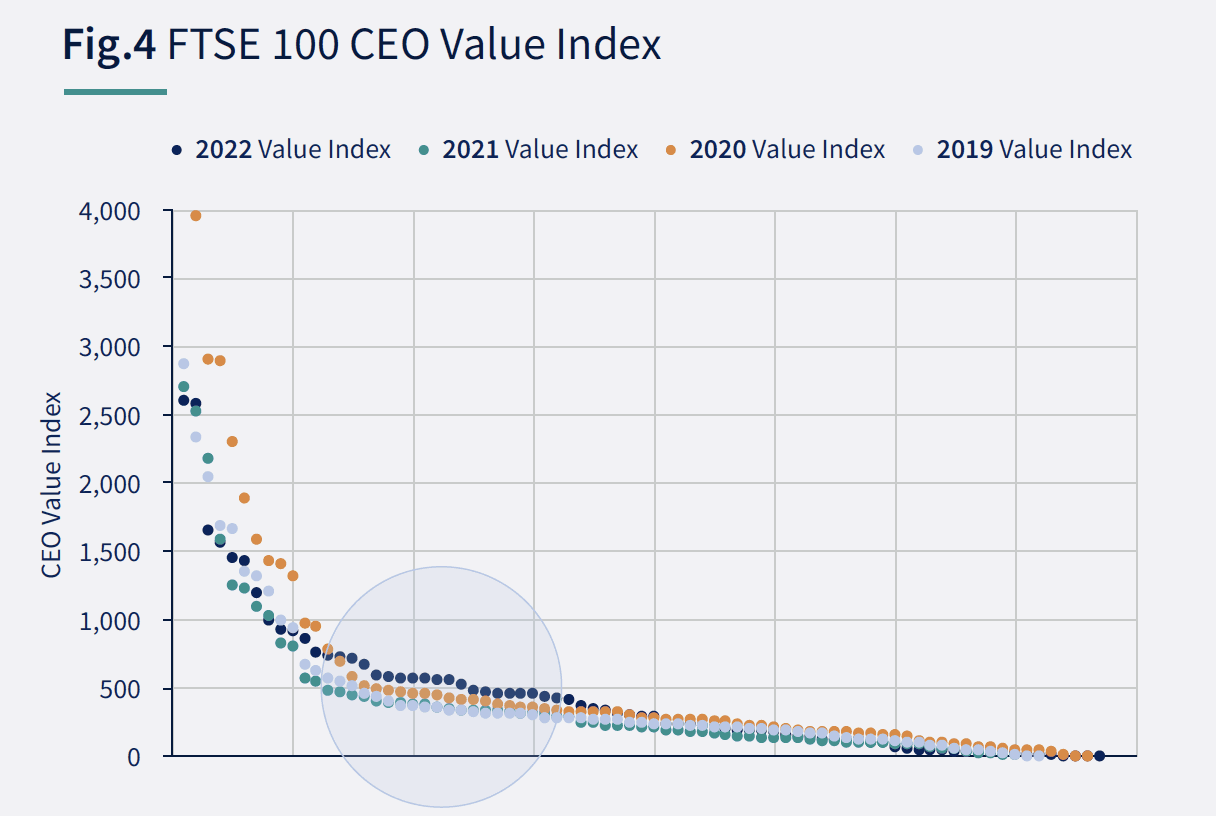
The graph below [Fig4] shows the Value Index scores of all the FTSE100 companies included in the last four cycles of the CEO Value Index.
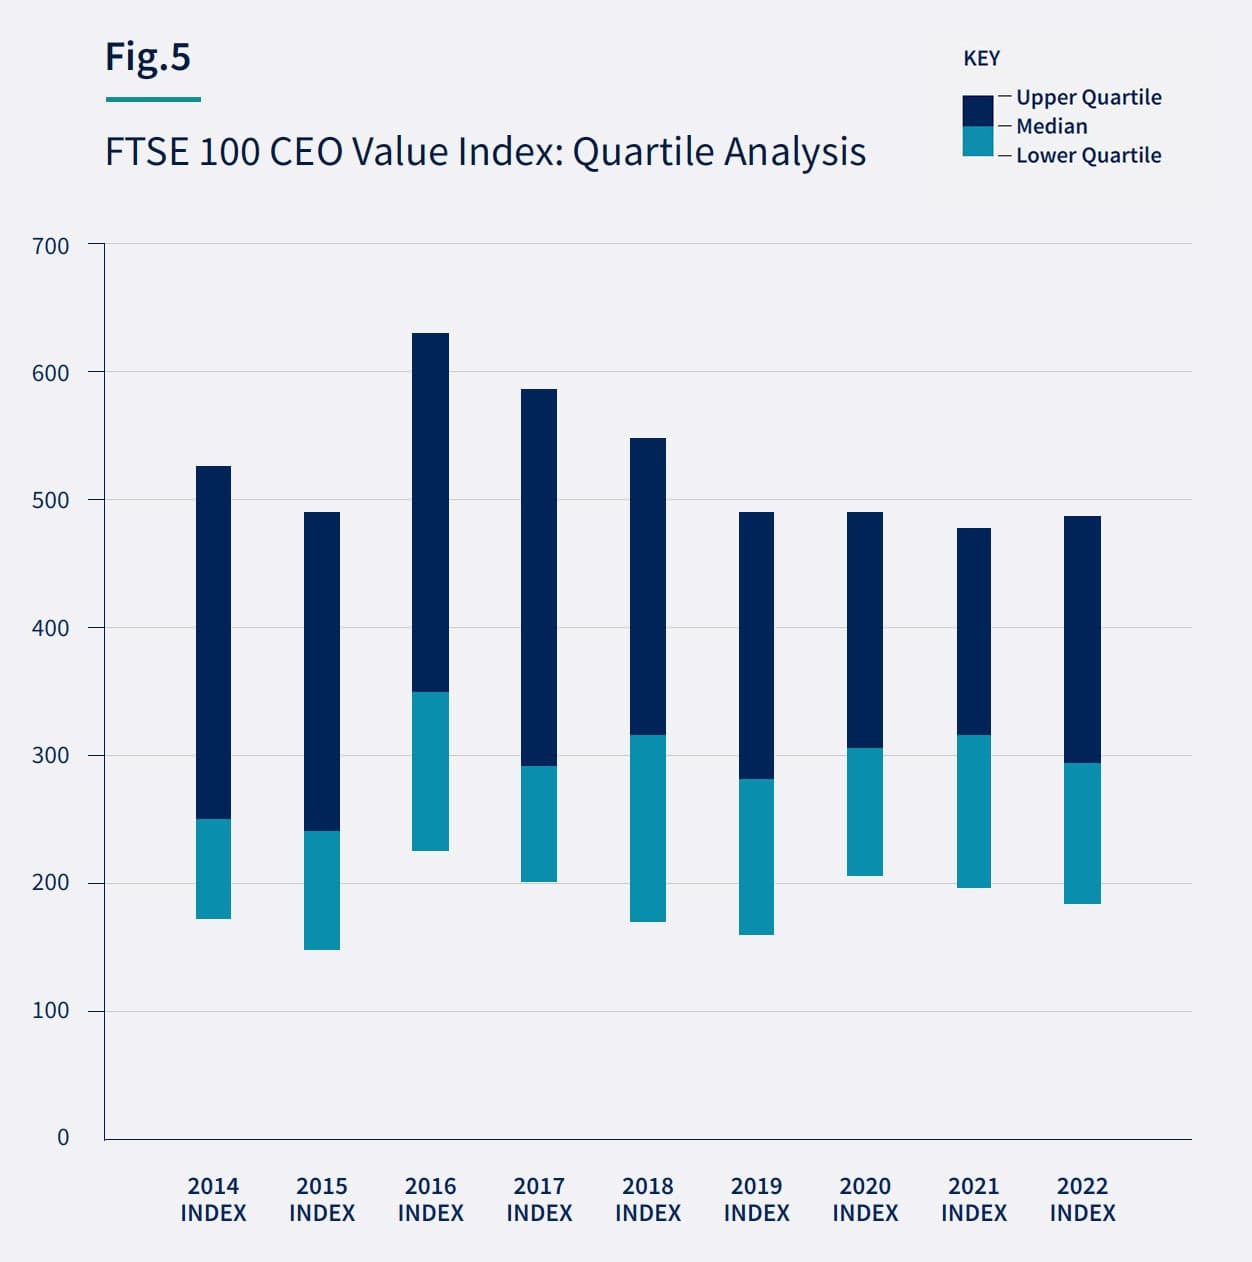
It is noted that although the 2022 Index has decreased at the top, the mid-pack companies have performed well [Fig. 4] and so the median is relatively consistent over the past 5 years.[Fig. 5] Therefore, this demonstrates more companies in the FTSE 100, are doing better in delivering value to shareholders as a whole than have done so in the past.
Short-Term Incentives
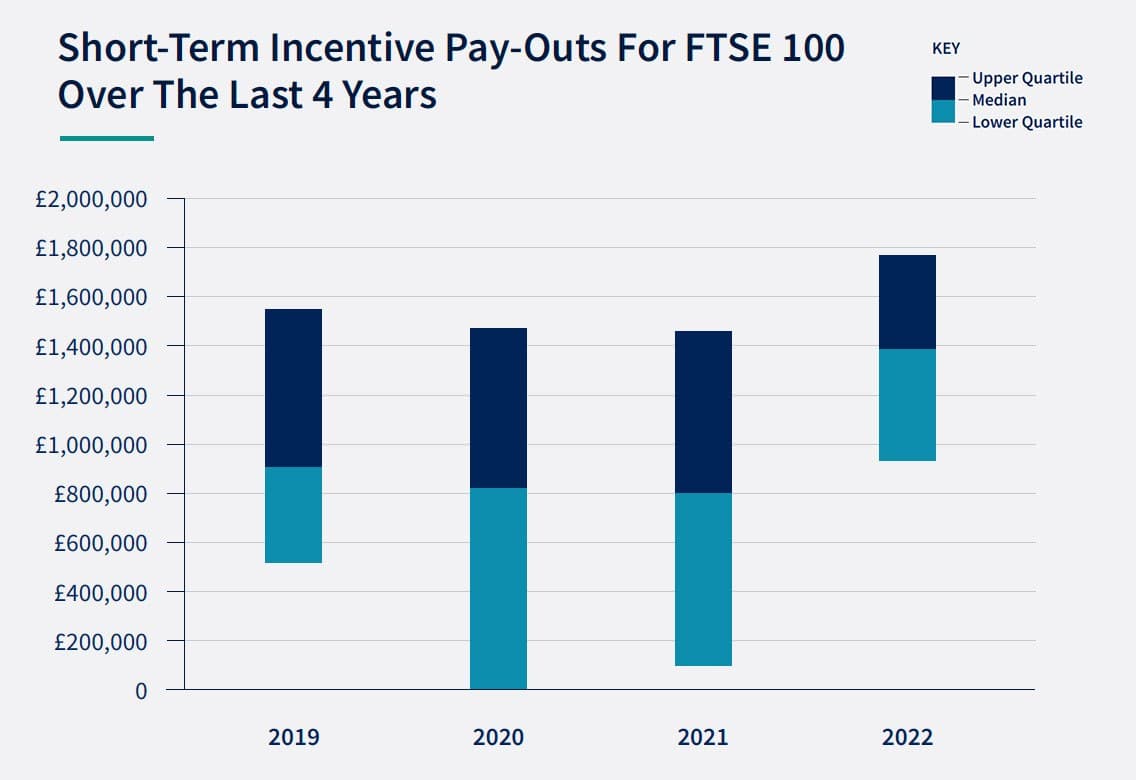
Over the past 3 prior years, pay-outs under FTSE 100 short-term incentive schemes have remained remarkably consistent. However, for 2022, the median STI pay-out has increased by 55% above 2019. This can at least in part be attributed to the knock-on Covid-impact of lowered performance measures and therefore, although many CEO’s took reductions in base pay and STI over 2020 and 2021, they are now recipients of windfall STI payments.
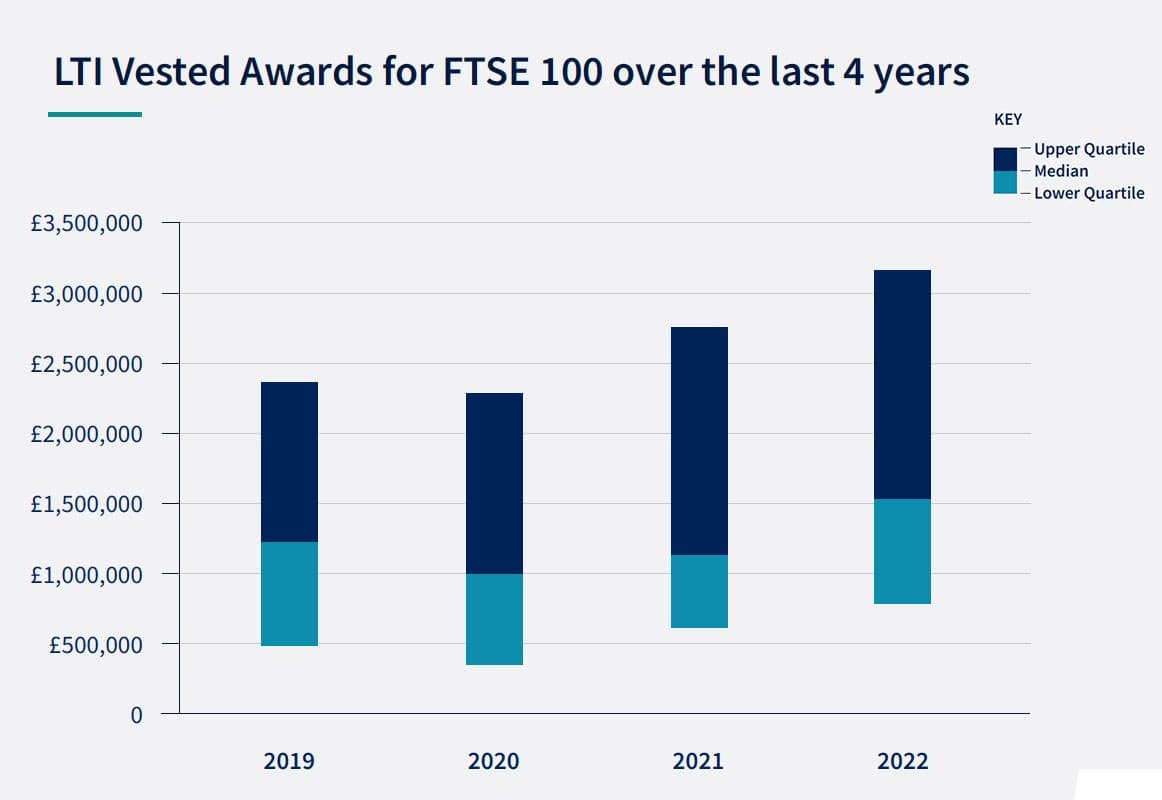
Long-Term Incentives
Pay-outs under long-term incentive schemes have also increased but to a lesser extent – the expectation being that this steady increase will continue in the next few years as the LTIs awarded during the 2019-2021, vest in the future.
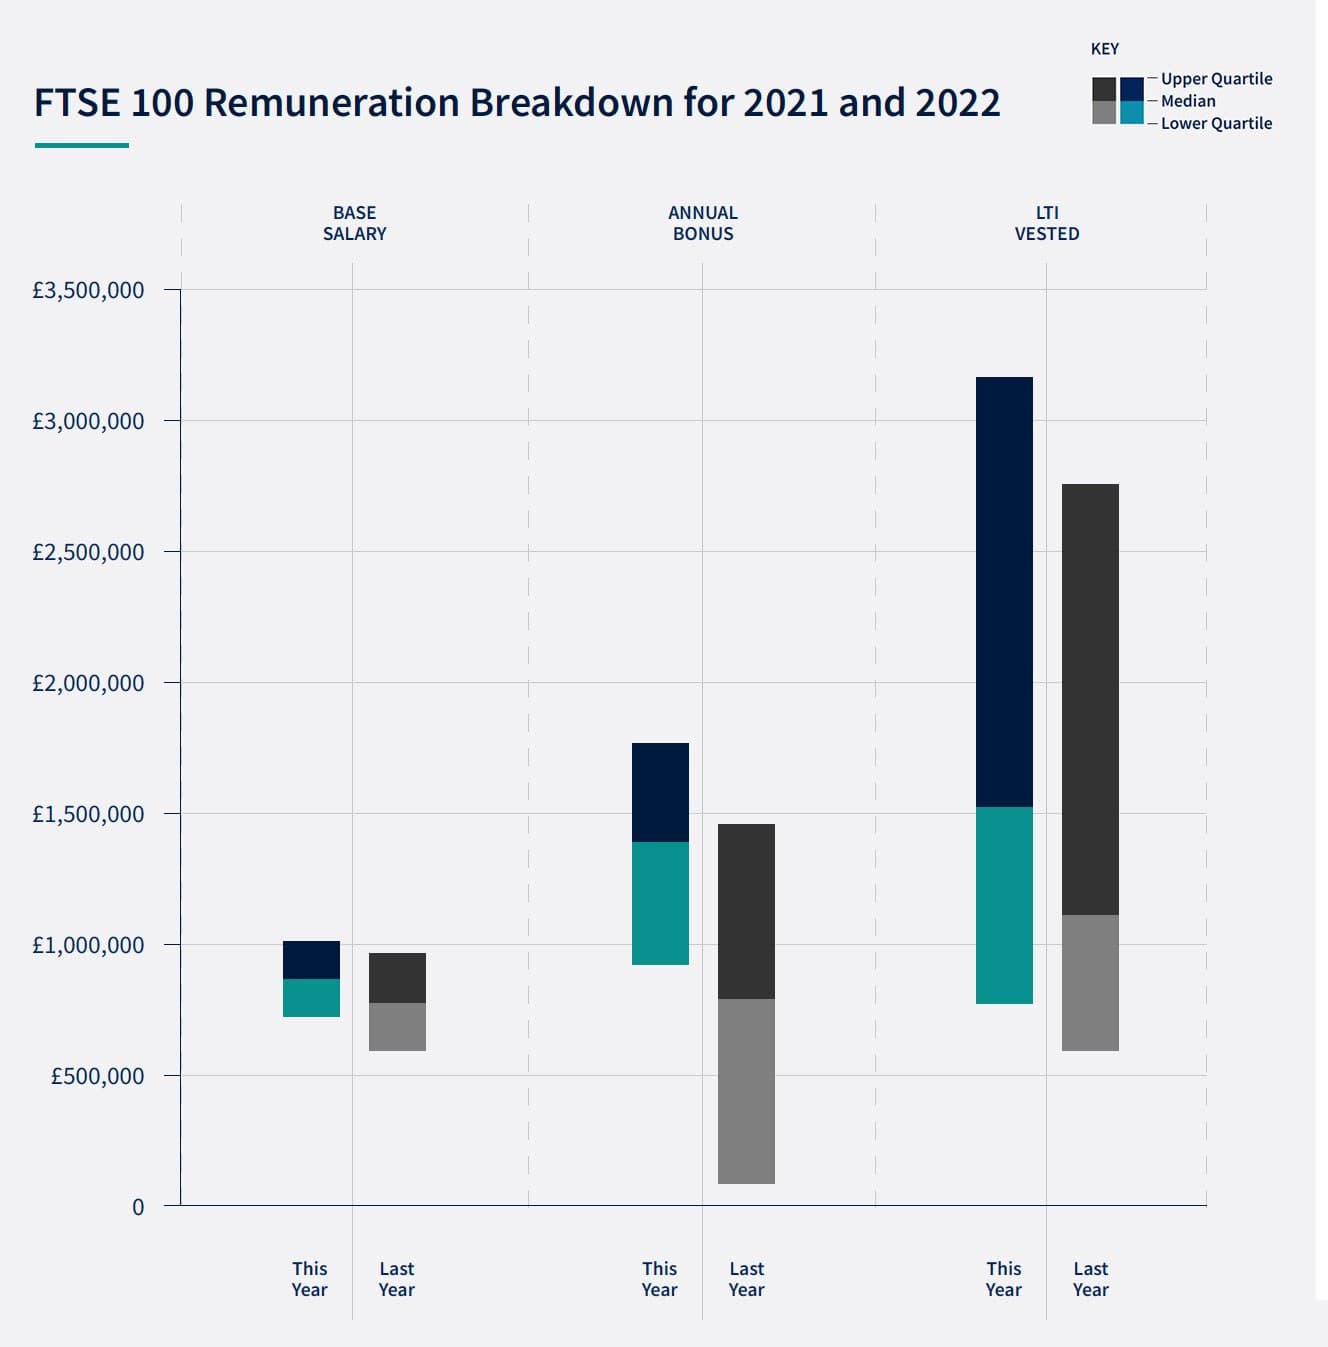
FTSE 100 Remuneration Breakdown
Looking at pay more recently, we can start to see companies recovering from COVID-19. Whilst base salaries have remained relatively flat, annual bonus and long-term incentive plan pay-outs in the most recent year are significantly up from the previous year (potential suggesting windfall gains). This in turn has had a knock-on effect, increasing total remuneration for executives.
Overview of 2022 CEO Value Index by FTSE Rank
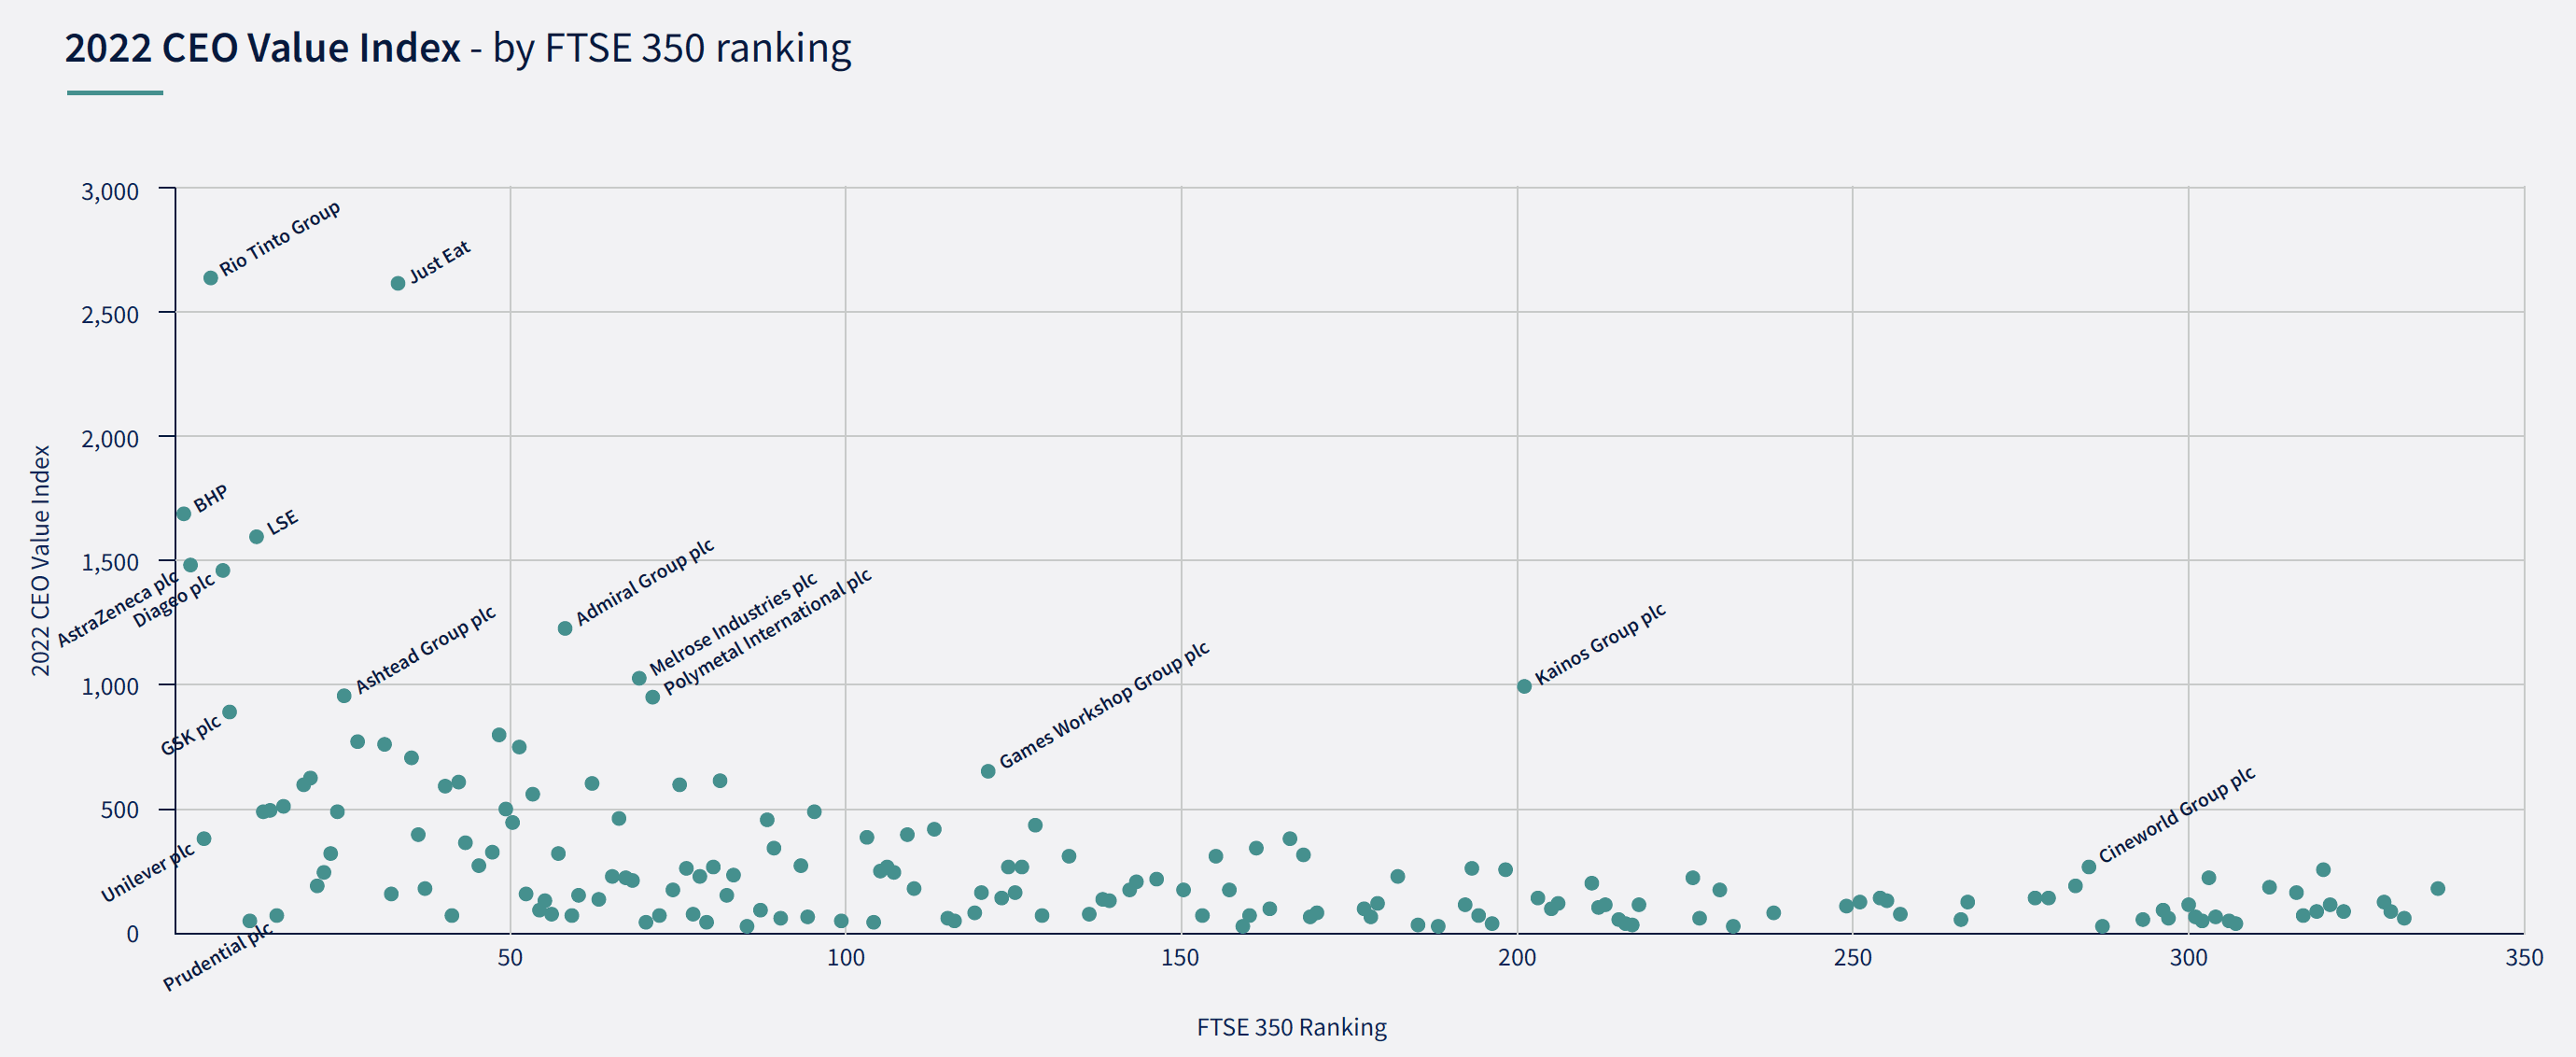
Note: Excludes any companies with negative Value Add and hence negative CEO Value Index.
Summary of our findings
- The largest companies (by market capitalisation) tend to exhibit high Index outcomes
2022 has demonstrated a few notable exceptions – smaller companies delivering excellent ‘value-for-money’ - The Index shows remarkable consistency – allowing Remuneration Committee Chairs to calibrate programmes over time, between sectors and between companies of differing sizes
but in 2022, the collective performance of all – in terms of ‘value for money’, as shown by the Index – has slipped back at the top end, but performed well within the ‘mid-pack’ - CEOs in larger companies are worth more to their shareholders, pound-for-pound of CEO pay, than CEOs in smaller companies
- The CEO Value Index performance varies significantly from sector to sector
and shareholders in energy companies have experienced more downside than others
For detailed findings, download the full CEO Value Index here:
Download The 2022 CEO Value Index