
The 2021 UK CEO Value Index
Published annually since 2012, the UK CEO Value Index aims to provide a unique perspective on pay for performance. Our unique and extensive database allows us to understand how remuneration committees are investing in their top executives, and the returns being made to shareholders.
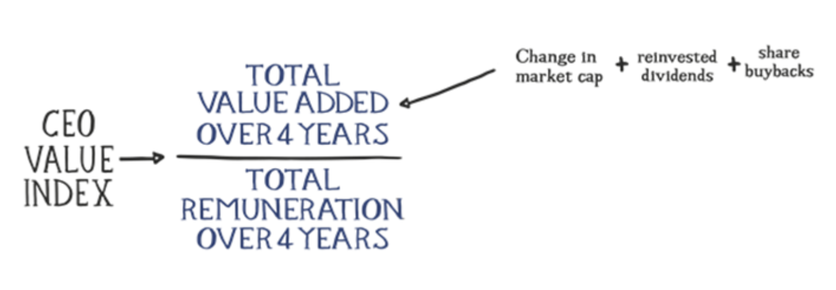
The UK CEO Value Index measures how much value a CEO adds to their company for every pound they are paid. The Index has a simple methodology which remuneration committees can easily apply to their own companies.
Methodology
Total Remuneration and Total Value Added are calculated over the four years from 2017 through to 2020. The calculation is applied only to those companies that have added value over the period. Data has been sourced as follows: Total Value Added figures were calculated from S&P CapIQ and Total Remuneration figures taken from Main Data Group and eReward.
The exact time periods that define the Index are summarised below.
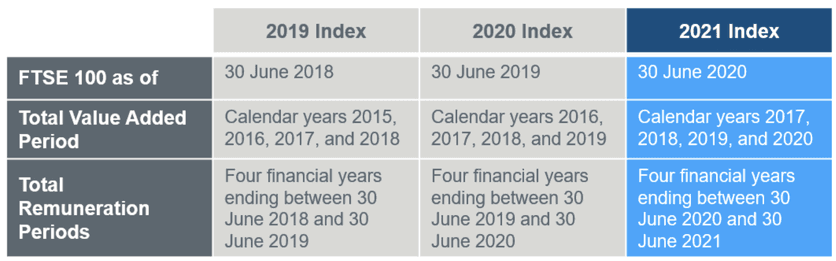
The 2021 Index is the first cycle to reflect the impact of COVID-19 on the UK CEO Value Index.
The following table shows the top performers in our 2021 Index. These companies had the highest Value Index, or in other words, the CEOs of these companies added the most value per pound they were paid.
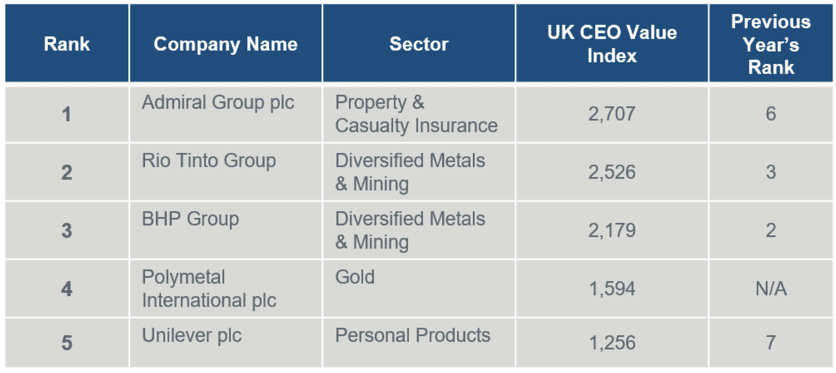
Note: Polymetal International plc has no ranking for the previous year due to it being a new entrant to the FTSE 100 for the 2021 UK CEO Value Index.
Key Findings
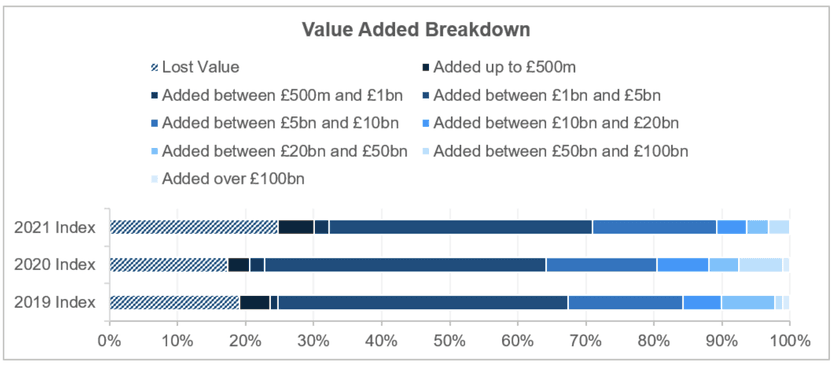
The graph below shows the Value Index scores of all the FTSE 100 companies included in the 2019, 2020, and 2021 Indexes.
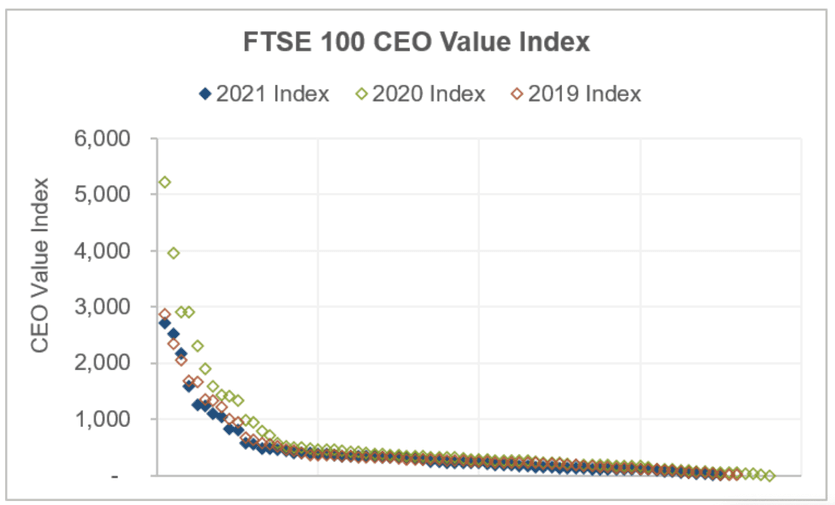
Our 2019 and 2020 Indexes showed that typically just under 20% of FTSE 100 companies lost value over each of the respective periods and around 10-12% added value in excess of £20bn. For the 2021 Index, the proportion of companies that lost value over the four-year period ending 31 December 2020 rose to 25% whilst the proportion of companies adding value in excess of £20bn fell to 6%.
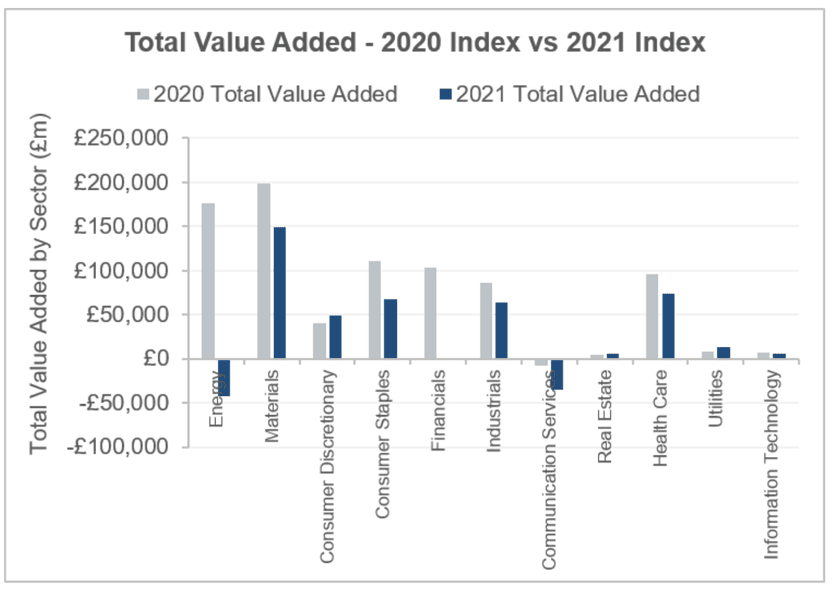
It is notable that performance in some companies and sectors has shifted considerably since our last Index with three of last year’s top performers falling out of the rankings after losing value over the 2021 Index period. The graph below breaks down total value added by each sector for both the 2020 and 2021 Index periods. It highlights the significant swing in value added, experienced in some sectors over the four-year periods ending 30 December 2019 and 30 December 2020 for the 2020 and 2021 Indexes respectively.
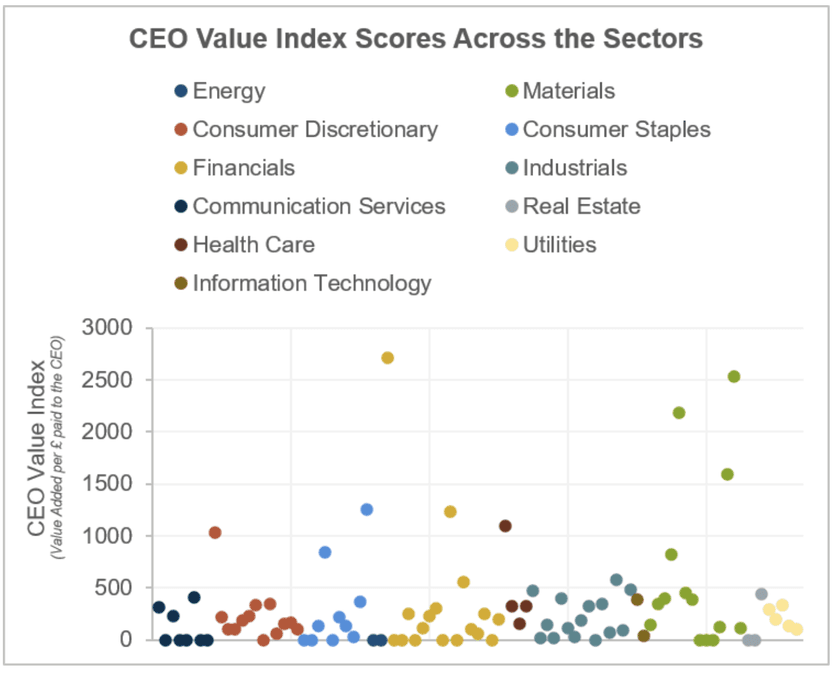
But what happens when we also factor in total remuneration; which sectors are scoring well in terms of their Value Index?
(Note: Those companies that lost value and therefore have no Index score are plotted at zero.)
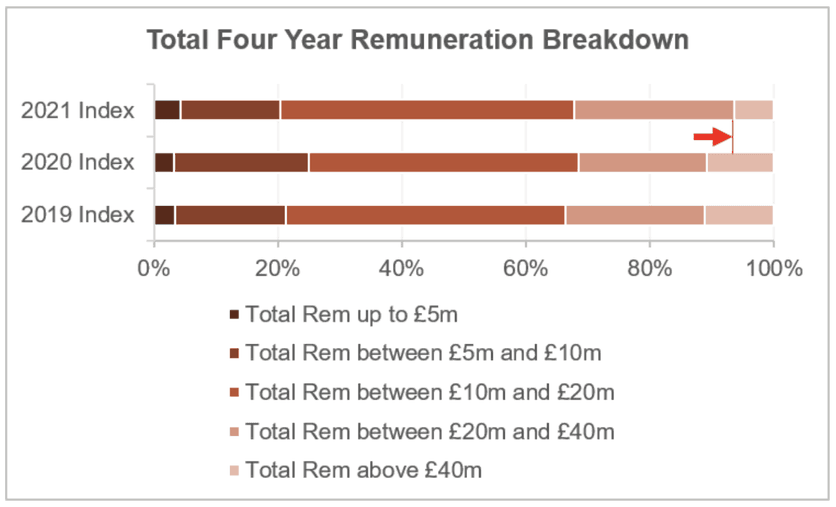
Looking at total four-year remuneration payable across the 2019, 2020, and 2021 Indexes, this highlights a decline in the proportion of FTSE 100 companies with total remuneration in excess of £40m.
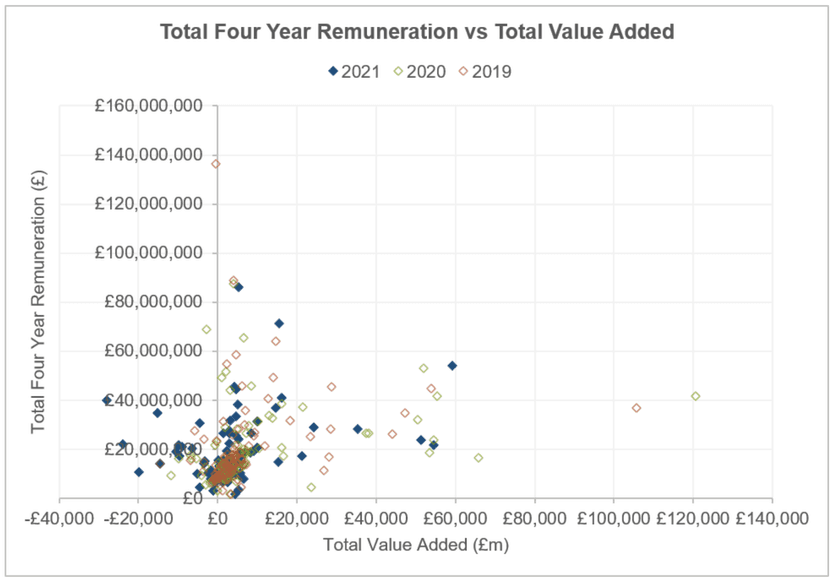
Comparing total value added and total remuneration over the four-year periods highlights the relationship between pay and value added, and the lack of alignment that exists in some companies. Whilst total four-year remuneration may have been more conservative in the 2021 Index, there are still a remarkable number of companies paying significant sums despite losing value. To illustrate this more clearly, below we plot total four-year remuneration against total value added over the same period for each of the 2019, 2020, and 2021 Indexes.
The graph below further highlights the magnitude of pay being awarded at those companies that have lost value over the four-year period. The graph splits the FTSE 100 into three groups. Groups 1 and 2 divide those companies that added value, with Group 1 being comprised of those companies that added the most value, and Group 2 those that added the least value. Group 3 is comprised of those companies that lost value over the period. The graph below sets out the remuneration paid to each of these three groups.
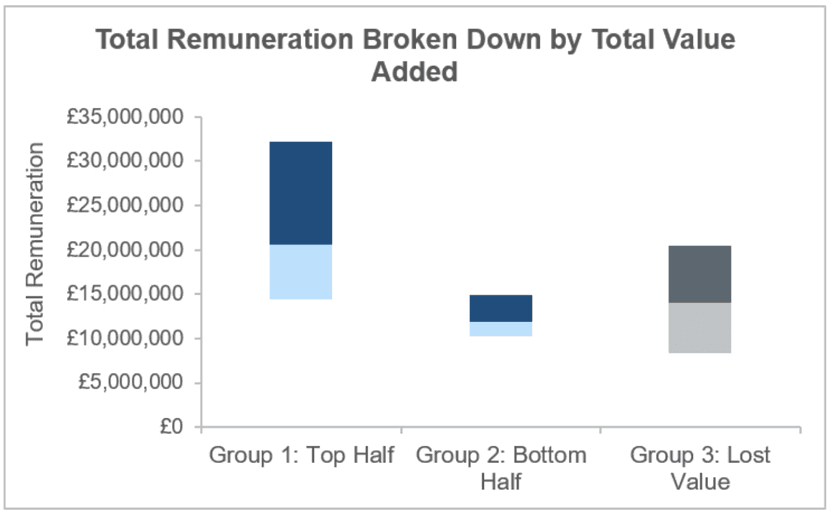
Not surprisingly, Group 1 companies have the highest total remuneration at upper quartile. It is notable however, that Group 3 companies who lost value for shareholders over the period are paid above Group 2 companies and, at upper quartile they’re on a par with the median of those companies that added the most value.
Whilst there is an element of correlation between total value added and total remuneration, it is clear from our analysis that this is not the primary driving factor. So what else is driving pay outcomes? Our analysis highlights that there is a relationship between pay and market capitalisation.
(Note: A log scale has been applied to better visualise the data over such a wide range.)

And a relationship between pay and revenues.
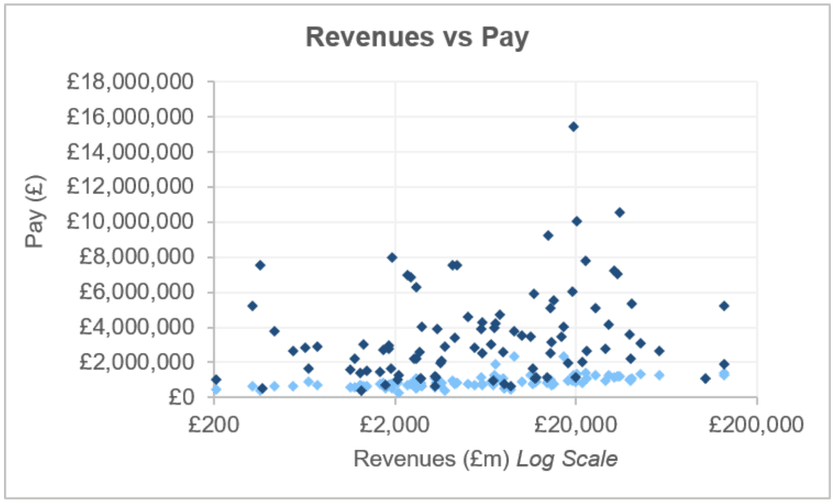
Together these graphs indicate that company size, measured by both market cap and revenues, are key drivers of pay at FTSE 100 companies, and not value added to shareholders.
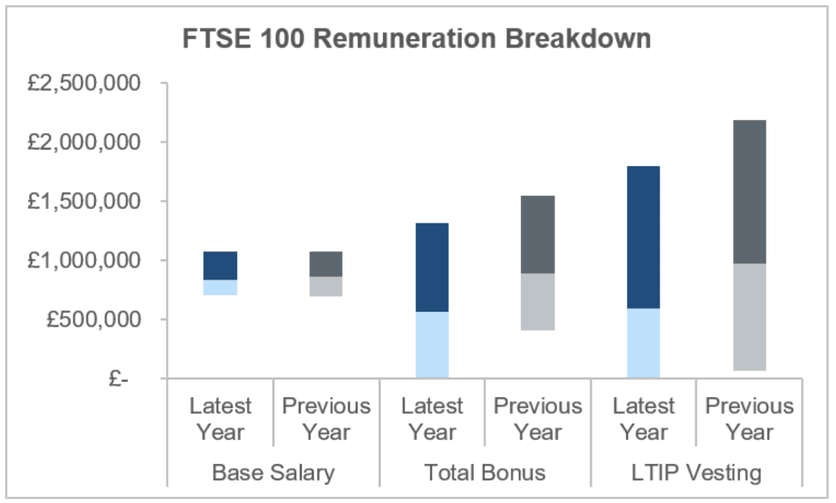
Looking at pay more recently, we can see the impact of COVID-19 on pay outcomes. Whilst base salaries have remained relatively flat, annual bonus and long-term incentive plan pay-outs in the most recent year are notably down compared to the previous year. This in turn has had a knock-on effect, lowering total remuneration for executives.
Conclusion
We can conclude that whilst the relationship between total value added and total remuneration still remains in place in 2021, despite all of its seismic shifts, the key driver for setting total remuneration remains company size—measured in terms of market capitalisation, or revenues. As the size of a company increases, the CEO’s total remuneration also increases. It is not, perhaps, how we would like it to be, but it is an observable fact.
The contents of this document are intended to cover only a few headlines from our 2021 work. If you’re interested in hearing more about our work or if you would like us to prepare a tailored report for your company, then please don’t hesitate to contact our London office.