Does the Investment Pay Off: The 2019 UK CEO Value Index
Introduction
Published annually since 2012, the UK CEO Value Index aims to provide a unique insight into pay-for-performance. Our database allows us to understand how remuneration committees are investing in their top executives and whether there are any indicative correlations across the FTSE 100.
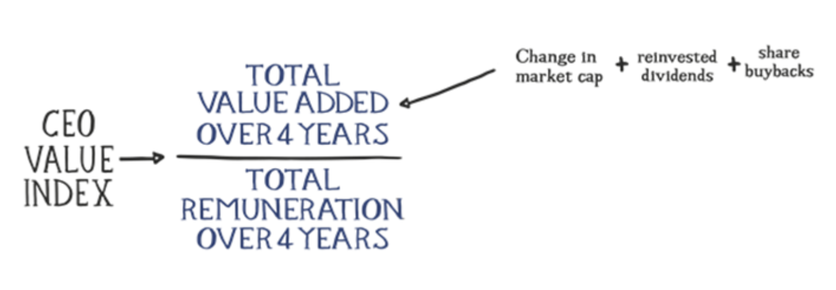
The UK CEO Value Index measures how much value a CEO adds to their company for every pound they are paid. The Index has a simple methodology which remuneration committees can easily apply to their own companies.
Total Remuneration and Total Value Added are calculated over the four years from 2015 through to the end of 2018. (Note: The calculation is applied only to those companies that have added value over the period.)
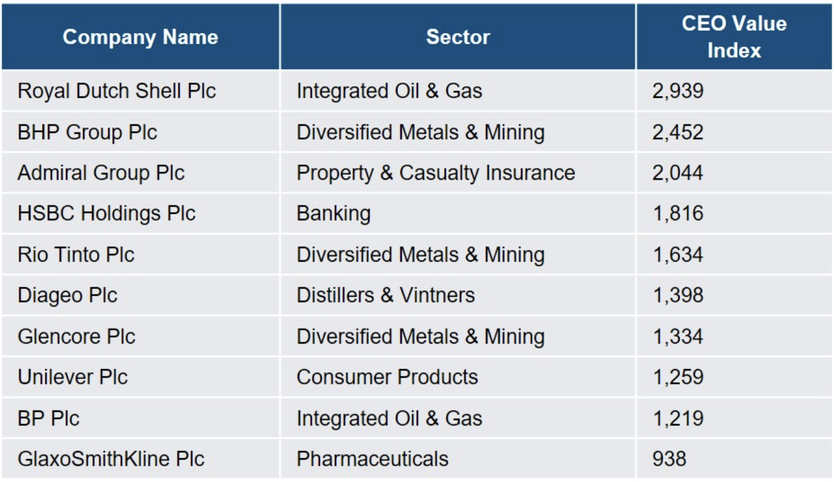
The 2019 UK CEO Value Index reviewed the FTSE 100 companies as defined on 30 June 2018. Of those reviewed, a fifth lost value over the period and just a tenth delivered more than £1,000 for every £1 paid to the CEO. The following table shows the top performers for 2019—these companies had the highest Value Index, in other words, the best CEOs in terms of delivered shareholder value.
Over the following pages we take a brief look at some of the key findings.
2019 UK CEO Value Index
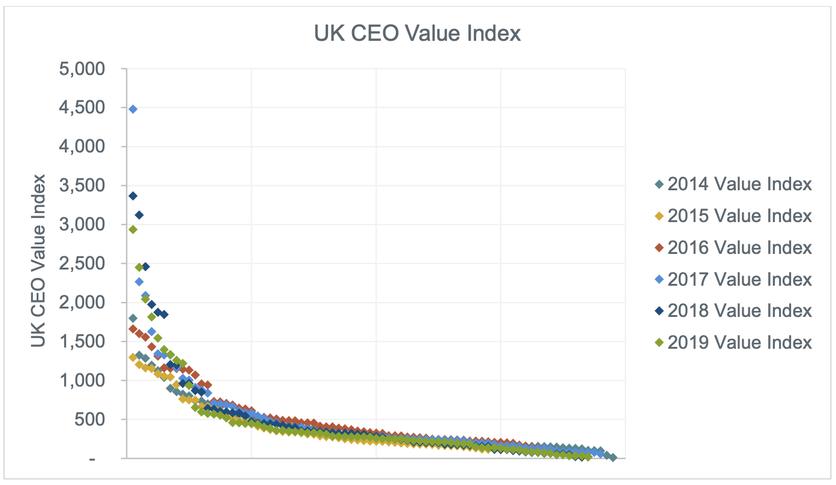
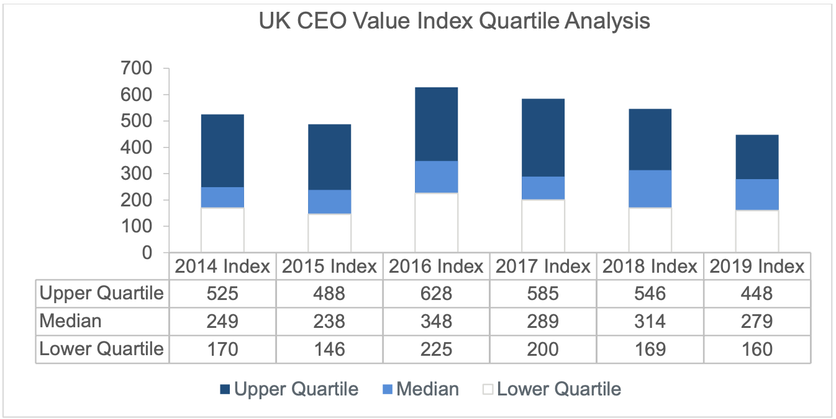
The graphs below show the Value Index scores of all the FTSE 100 companies included in the last six cycles of the UK CEO Value Index.
Our Index has identified a small group of very consistent performers. Four companies have ranked in the top 20 for each year of FTSE 100 since 2012 and a further six have ranked in the top 20 in all but one of the last six rolling four-year periods.
A Closer Look at Pay
Short-Term Incentives
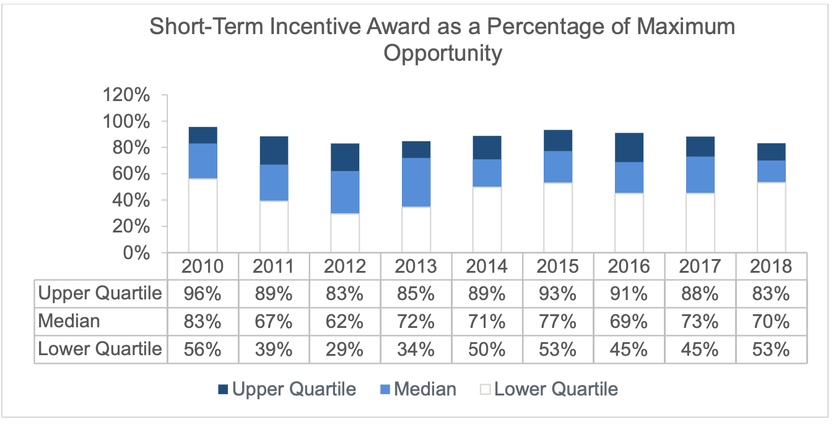
Since 2010, payouts under FTSE 100 short-term incentive schemes have remained remarkably consistent. The average short-term incentive payout at upper quartile has been 89% of maximum opportunity, falling to 72% at median and 45% at lower quartile.
Long-Term Incentives
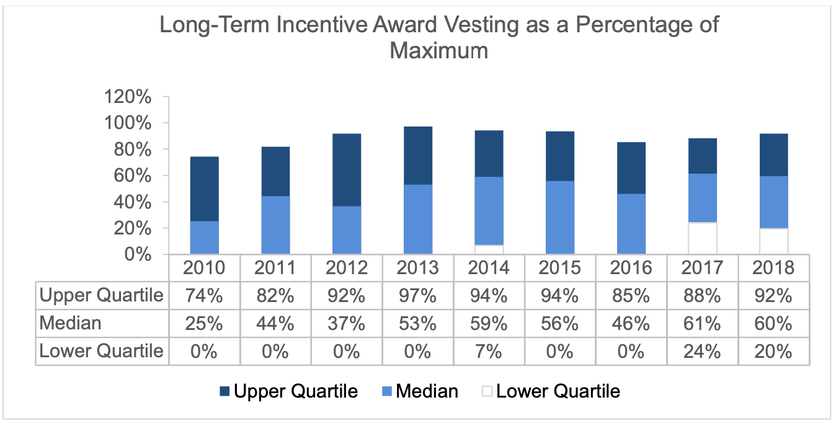
Payouts under long-term incentive schemes have by contrast been less consistent. There has been a significant decrease in the range of vesting outcomes, in particular for both 2017 and 2018 (note the significant increase at lower quartile for both these years).
Three Tiers and Value Losers
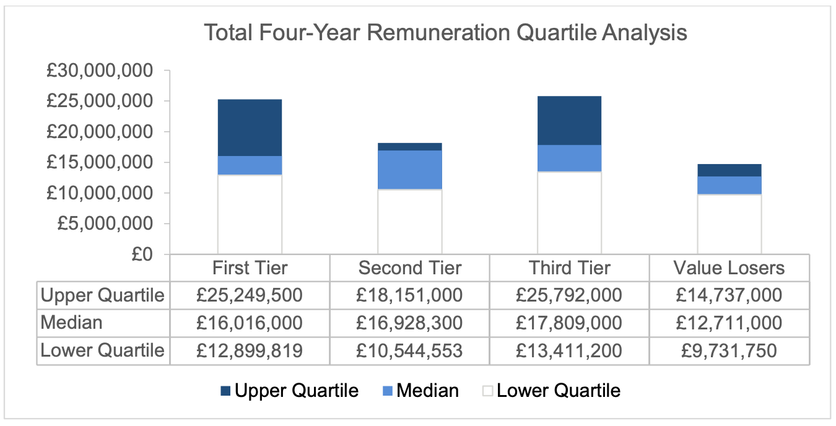
Below we divide the FTSE 100 into four tiers based on a company’s Value Index ranking so that tier 1 is comprised of the top third of Value Index performers—these are the companies that deliver the most to shareholders for every £1 of CEO remuneration. Tier 2 is the second third and tier 3 is the final third. The fourth tier, ‘value losers’, is comprised of those companies that did not add value to shareholders over the period.
Of particular interest is the scale of pay at second and third tier companies versus first tier. In fact, pay at upper quartile for third tier companies exceeds upper quartile pay for first tier companies despite third tier companies adding a tenth of the value of first tier companies at upper quartile.
The contents of this document are intended to cover only a few headlines from our 2019 work. If you’re interested in hearing more about our work or if you would like us to prepare a tailored report for your company, then please don’t hesitate to get in contact at info@remunerationassociates.com - or see our contact us page.
