2023 CEO Value Index and Shareholder Voting
This research builds upon our 2023 CEO Value Index (“CVI”) - as featured in The Sunday Times
As a reminder, our Index shows how much CEOs deliver to shareholders for each £1 they are paid and demonstrates whether a CEO is ’value-for-money’, or not.
By ranking CEO’s ‘value for money’, and then looking at shareholder voting patterns, we wanted to find out whether shareholders simply focus on how much CEOs are paid, or whether they focus on the value delivered. Surely shareholders wouldn’t be simply focused on the headline pay figure?
Our findings indicate they are. We found no correlation between how much value a CEO has added (the CVI score) and shareholder voting outcomes (for both the latest remuneration policy within the last 4 years and latest remuneration report). Shareholder voting patterns on executive pay seem at least as emotional as they are rational.
This analysis focuses exclusively on FTSE 100 companies as defined in the latest CVI report.
Download the CEO Value Index 2023
Sample Group Selection
We selected five groups of 10 companies across the CEO Value Index based on how they performed in the 2023 CVI i.e. looking at companies who performed well, those who were “average” and those who performed poorly. The companies in the Top 10 are those which have delivered the most value to shareholders for every £1 paid to the CEO over the past 4 years, and so forth.
92 companies were eligible for this year’s CVI. We do not calculate the CVI for companies with negative value added.

Shareholder Voting
We analysed shareholder voting results for each company, looking at voting outcomes for both their remuneration policy and, in a separate vote, for the directors’ remuneration report (“DRR”)
We expected to see the ‘Top 10’ or even the ‘Top Half’ gaining solid ‘For’ voting, while the remainder we would see votes ‘For’ at their lowest.
That is not the case.
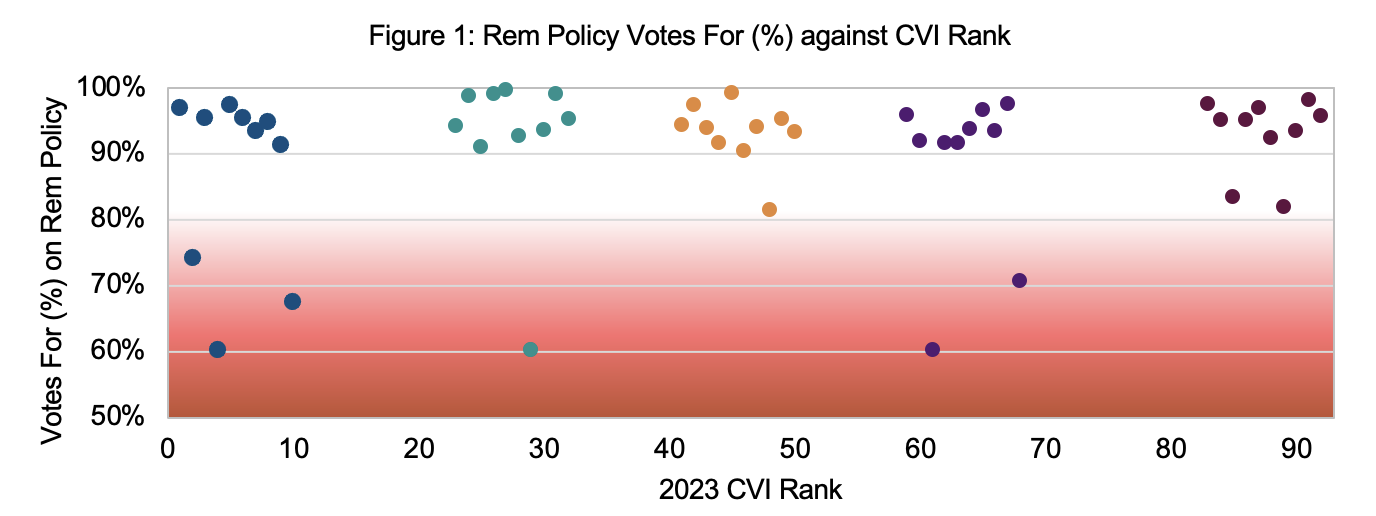
No distinct pattern emerged (See Figure 1).
If a company receives less than 80% votes ‘For’ a resolution, it must consult shareholders to find out the reasons why. Then the company must publish an update on the relevant shareholder concerns and what subsequent actions have been taken as a result within six months after the vote.

Two constituents in the Top 10 received notably low votes ‘For’ their remuneration policy.
- One of these companies received a 60.2% vote ‘for’ their remuneration policy, which sought an increase in the CEO’s maximum LTIP payout from 550% to 650% in response to the challenges posed by COVID-19. This resulted in a number of shareholders voting against the policy. Whilst this company received the lowest voting outcome on their remuneration policy out of the Top 10, they provided significant value add to shareholders and ranked fourth in the CVI.
- The other company that received a low vote ‘for’ was at 68.5%. The reason for the high vote ‘against’ was a misalignment between the quantum of LTIP awards for executive directors and market norms, below-market shareholding requirements for executive directors, and the absence of a mandatory deferral of a portion of the annual bonus for executive directors.
On the other hand, remuneration policy votes for the Bottom 10 companies were strong across the board.
Are incentive plans which may (controversially) offer higher pay – but for higher performance - unpopular with shareholders? Since the best value CEOs see fewer votes ‘For’, that would seem the case.
Does this mean that shareholders only support “vanilla” incentive plans, irrespective of whether they drive shareholder value?
Or do FTSE 100 shareholders not consider value creation when casting their votes?
Total Remuneration vs Shareholder Voting Outcomes
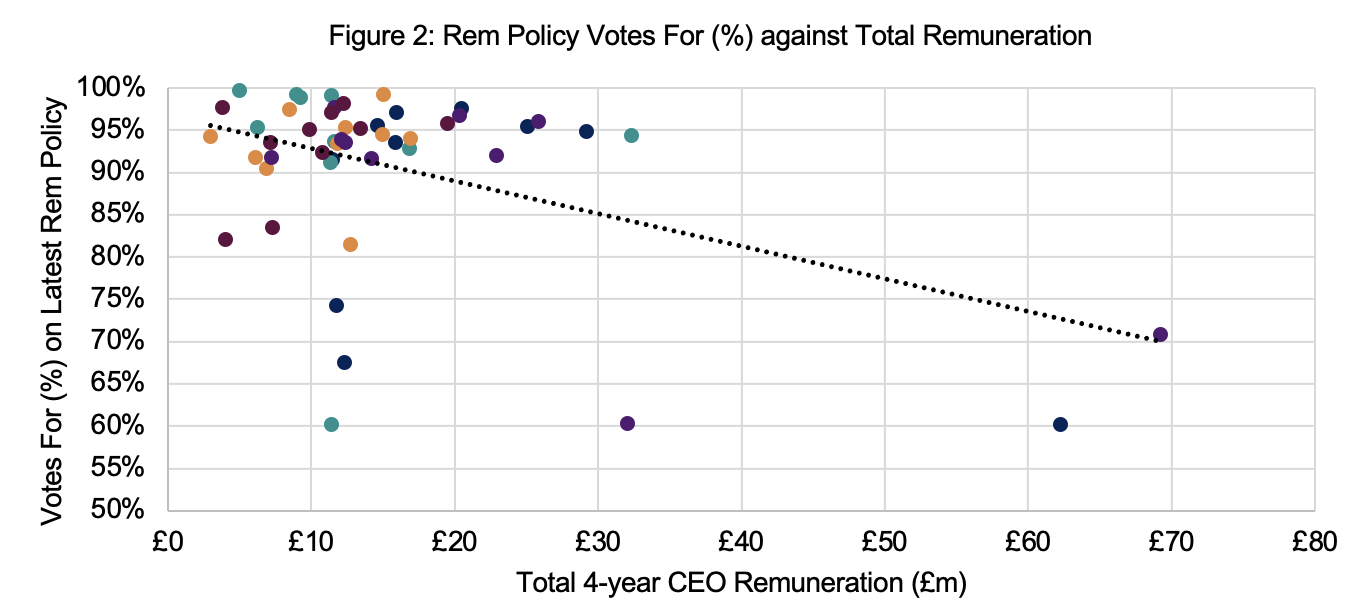
The relationship between shareholder voting outcomes and a CEO’s total remuneration over the last four years (what the CEO has actually been paid), is much clearer. Those companies who pay their CEOs more receive lower votes “For” from shareholders. See Figure 2.

Conclusion
When looking at a company’s CEO Value Index - the extent to which CEOs are ‘value-for-their-money’ - and comparing it with shareholder voting results, there is no pattern. One might argue that voting is contrary to expectations.
However, if we look at total remuneration alone, shareholder voting is clear: higher total remuneration generates more votes ‘against’ their latest remuneration policy and report.
There is, it would appear, a form of shareholder voting Against ‘pile-on’ if the CEO is paid very well, despite out-performance.
If ‘value for money’ is less a factor than simple headline pay figures, shareholders are sending a mixed signal (in the UK). Surely strong performance should be lauded and the rewards seen as justified.
Note: All data has been sourced from each companies latest annual report. Financial information has been sourced from S&P Capital IQ.
