2022 Supplemental CEO Value Index
We have created a 2022 Supplemental CEO Index report which looks at only the current FTSE100 and re-calculates the Index over a 4 year period up to the end of 2022.
DOWNLOAD THE SUPPLEMENTAL CEO VALUE INDEX
The CEO Value index is produced by us on an annual basis and the 2022 CEO Value Index was published in early January this year. As we noted then, there was an unavoidable time-lag in the production of that version of the report and the Value Added components [which includes change in the Market Capitalisation (‘Market Cap’)], were measured up to the end of 2021.
For keen observers, one of the top performers identified in the 2022 Index was - most notably - Just Eat plc. The subsequent demise of this company in the past year pointed us toward the need for a rapid update. Just Eat’s dramatic fall in share price, from Q4 2021 to Q4 2022, raised some questions in our minds on the timing of our analysis, given the timeframe of the global pandemic.
We were curious – what if we look at the current FTSE100 and consider their more recent financial performance, will the Index change?
We have created a 2022 Supplemental CEO Index report which looks at only the current FTSE100 and re-calculates the Index over a 4 year period up to the end of 2022.
The results are interesting
We will be publishing our 2023 CEO Value Index in Q3 2023. It will be interesting to understand the impact of the post-covid remuneration windfall payouts and the extent that the current turbulence in the Financial sector is reflected in the CEO Value Index.
Over the following we take a brief look at some of this year’s key findings. If you would like to learn more about the Index or request a tailored report for your company then please don’t hesitate to get in touch with us at info@remunerationassociates.com.
Note All remuneration data is sourced from eReward Database and Annual reports, financial information from S&P Capital IQ
Introduction
Published annually since 2012, the CEO Value Index aims to provide a unique insight into pay-for-performance. Our database allows us to understand how Remuneration Committees invest in their top executives, and the lessons learned – on pay levels, and performance levels.
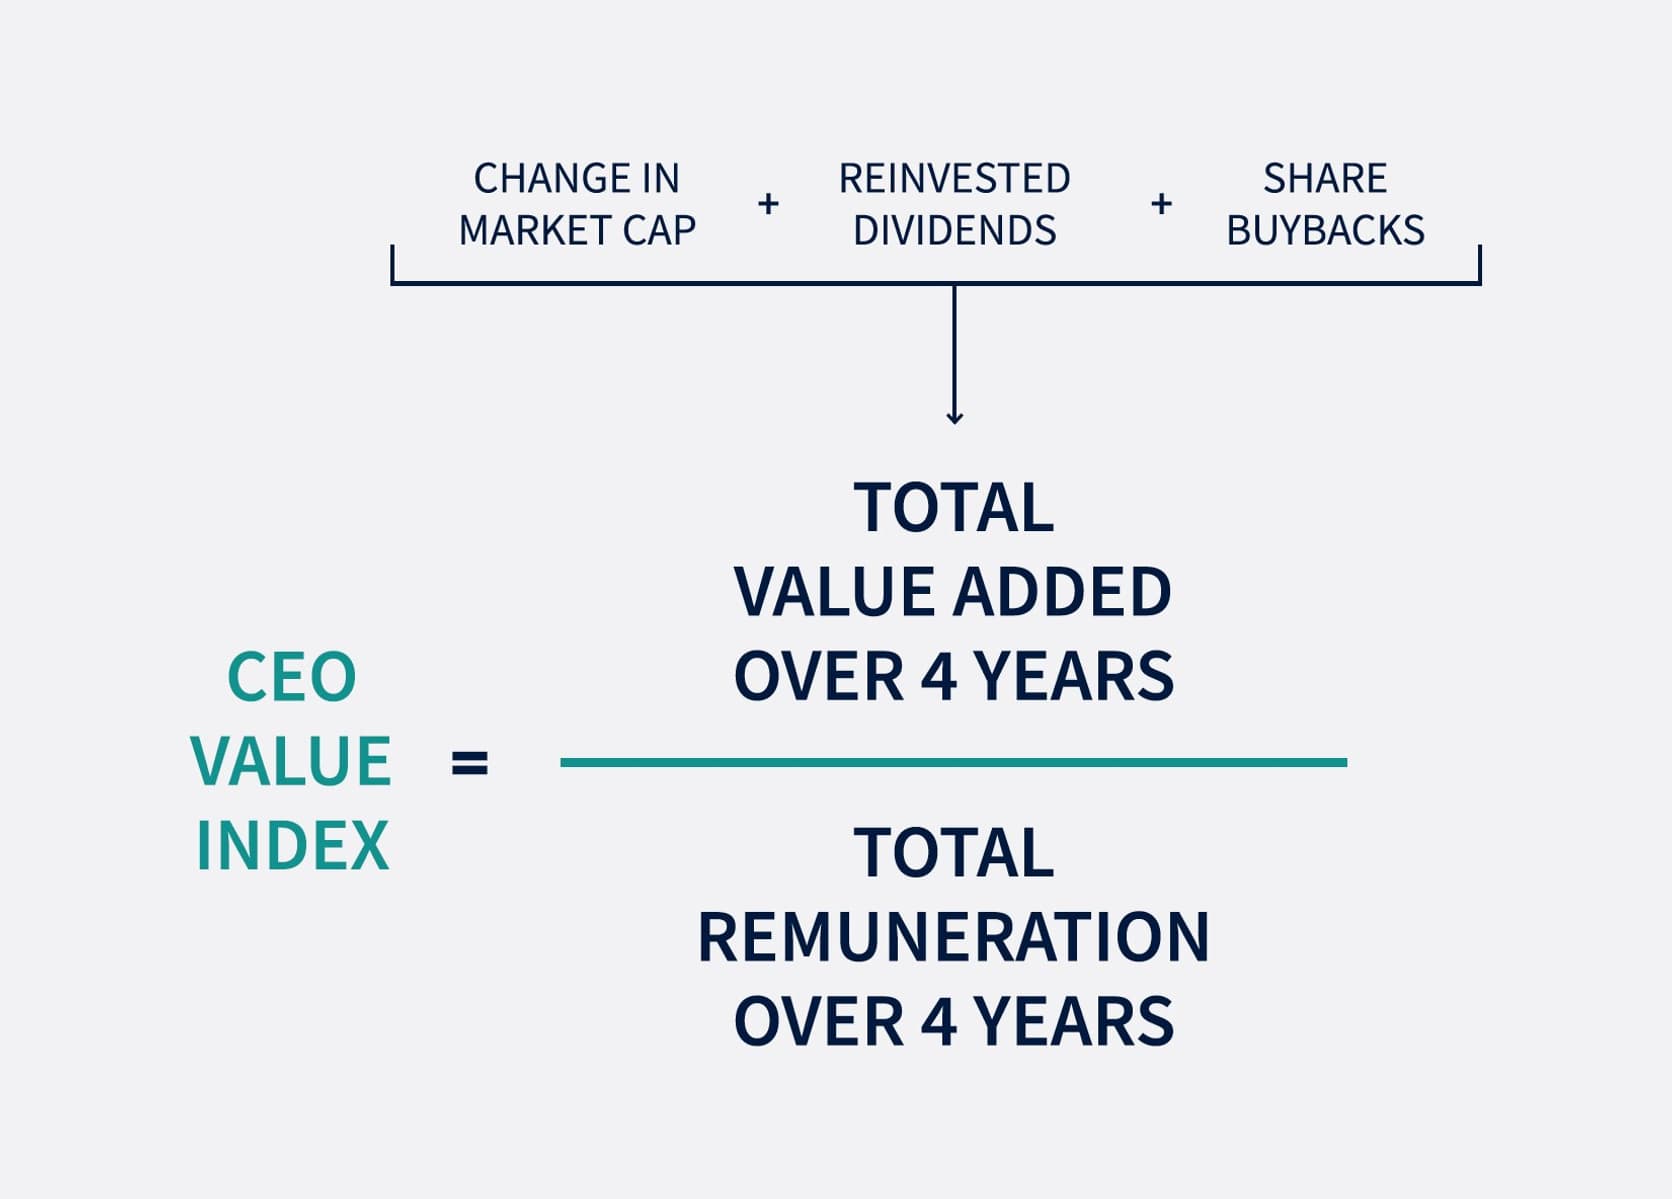
As a reminder: the CEO Value Index measures how much value a CEO adds to a company for every pound or dollar they are paid. The Index is a sophisticated methodology, but simple to understand. It can easily be applied by Remuneration Committees to their own decision-making.
Total Remuneration and Total Value Added are calculated over a four year period. In the case of the 2022 Supplemental Index that is from Q1 2018 through to the end of Q4 2022. (Note: The calculation only applies to those companies which have added value over the period).
2022 Supplemental CEO Value Index Top 10
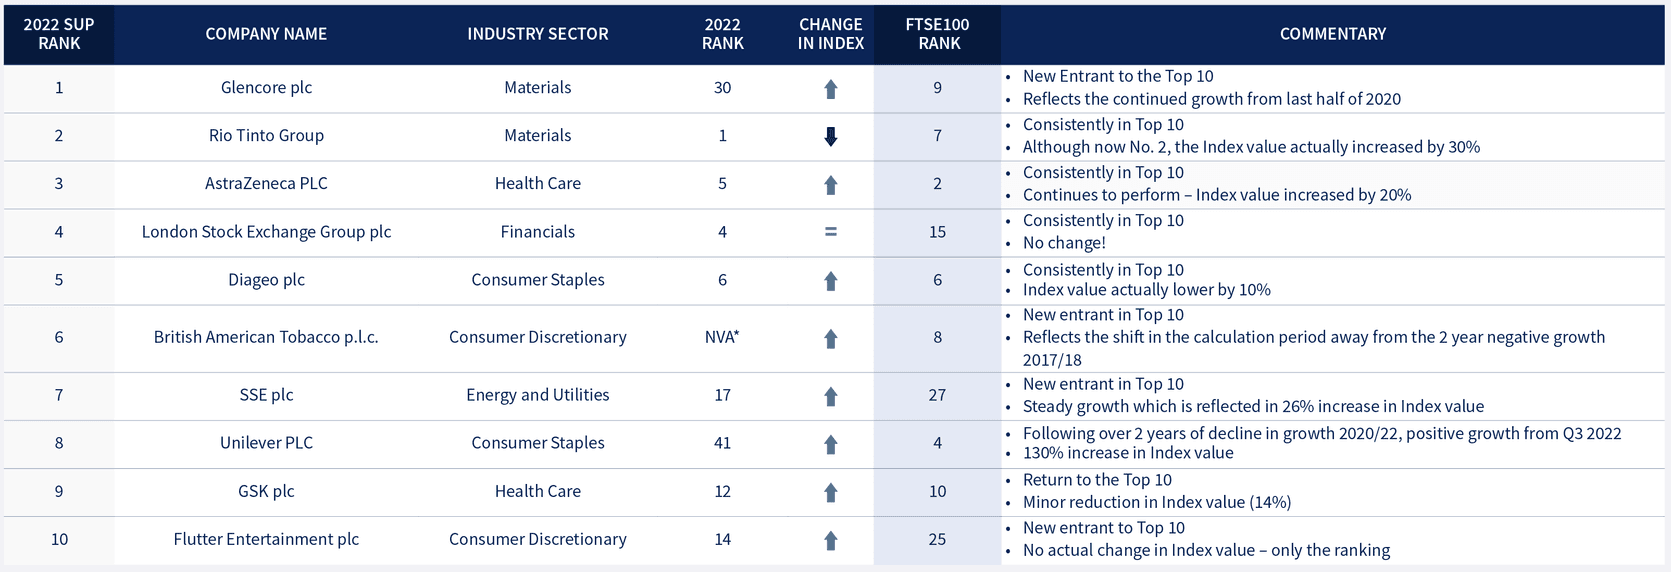
The 2022 Supplemental CEO Value Index reviewed the FTSE100 companies as defined at 31st December 2022. Of those reviewed, 28% lost value over the period and 5% delivered more than £1,000 for every £1 paid to the CEO.
The following table shows the top performers of the 2022 Supplemental Index period, i.e. the companies with the highest CEO Value Index, ‘the best value CEOs’, highlighting the change from the original 2022 Index and the current FTSE100 ranking.
The Fallen…
The 2022 Supplemental CEO Value Index reviewed the FTSE 100 companies as defined at 31st December 2022.
The following table identifies those companies that are no longer in the Top 10:

2022 Supplemental CEO Value Index - FTSE 100
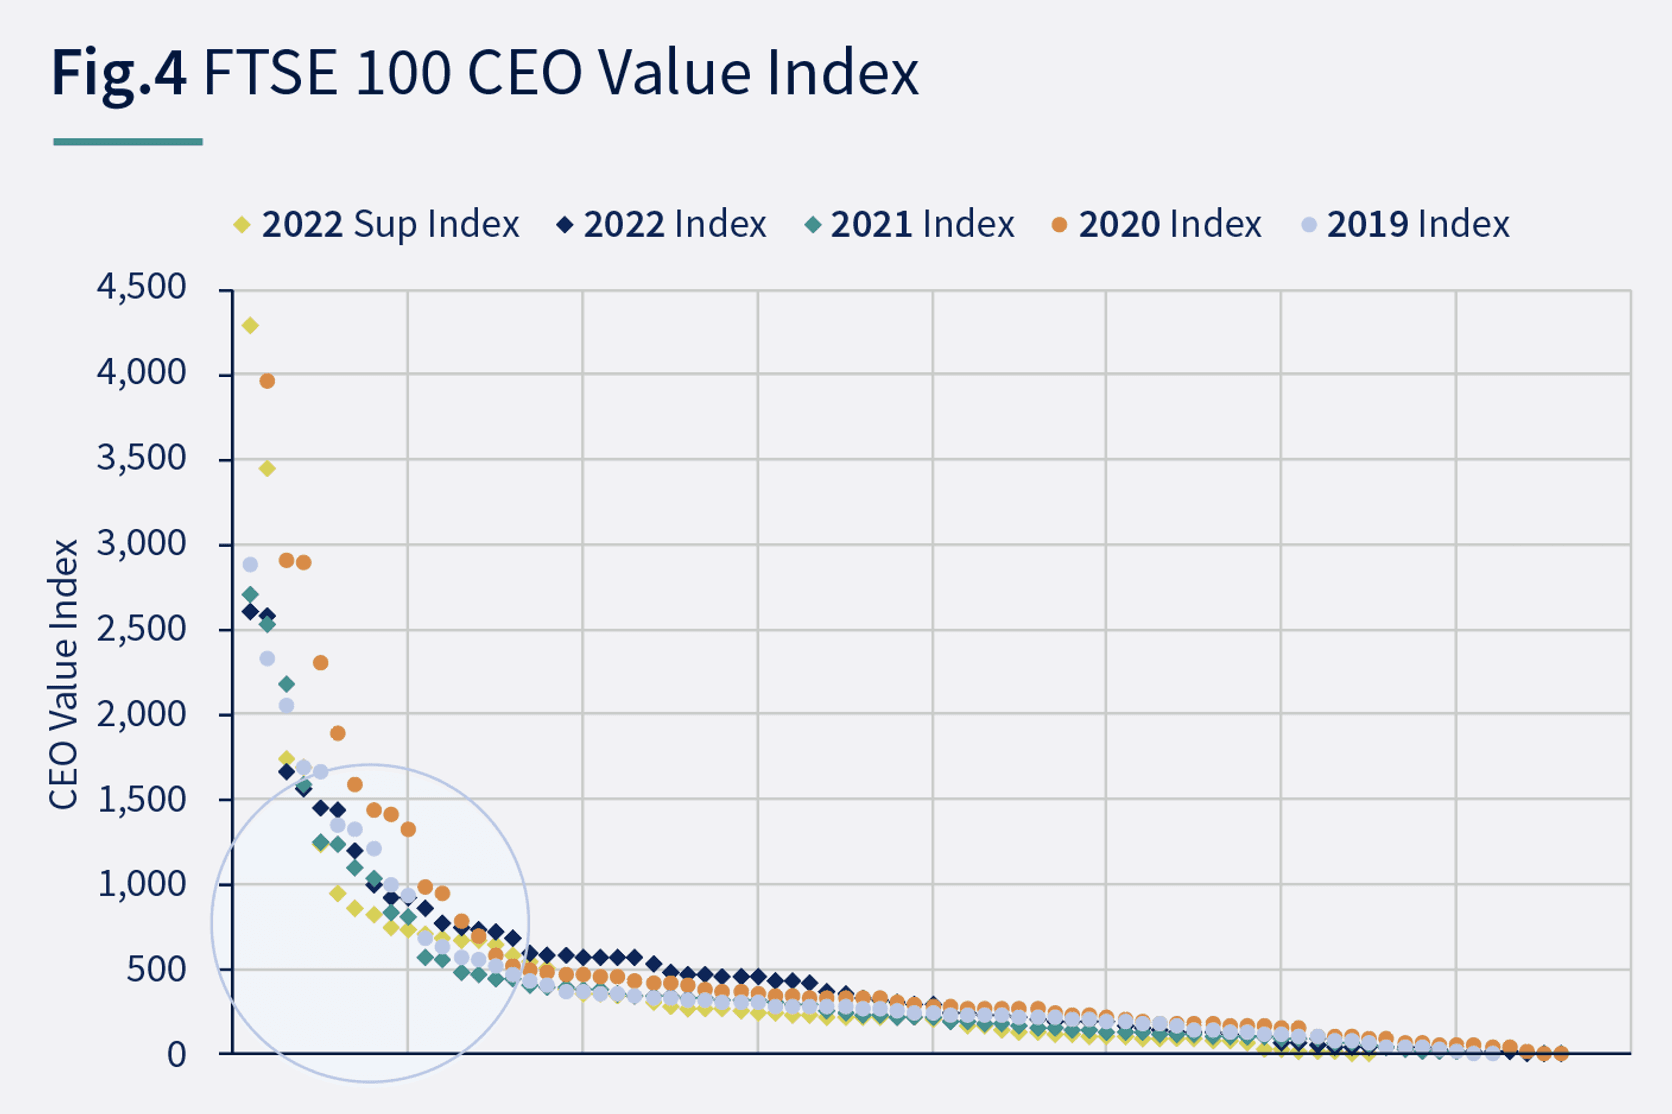
The graph below [Fig4] shows the Value Index scores of all the FTSE100 companies included in the last five cycles of the CEO Value Index.
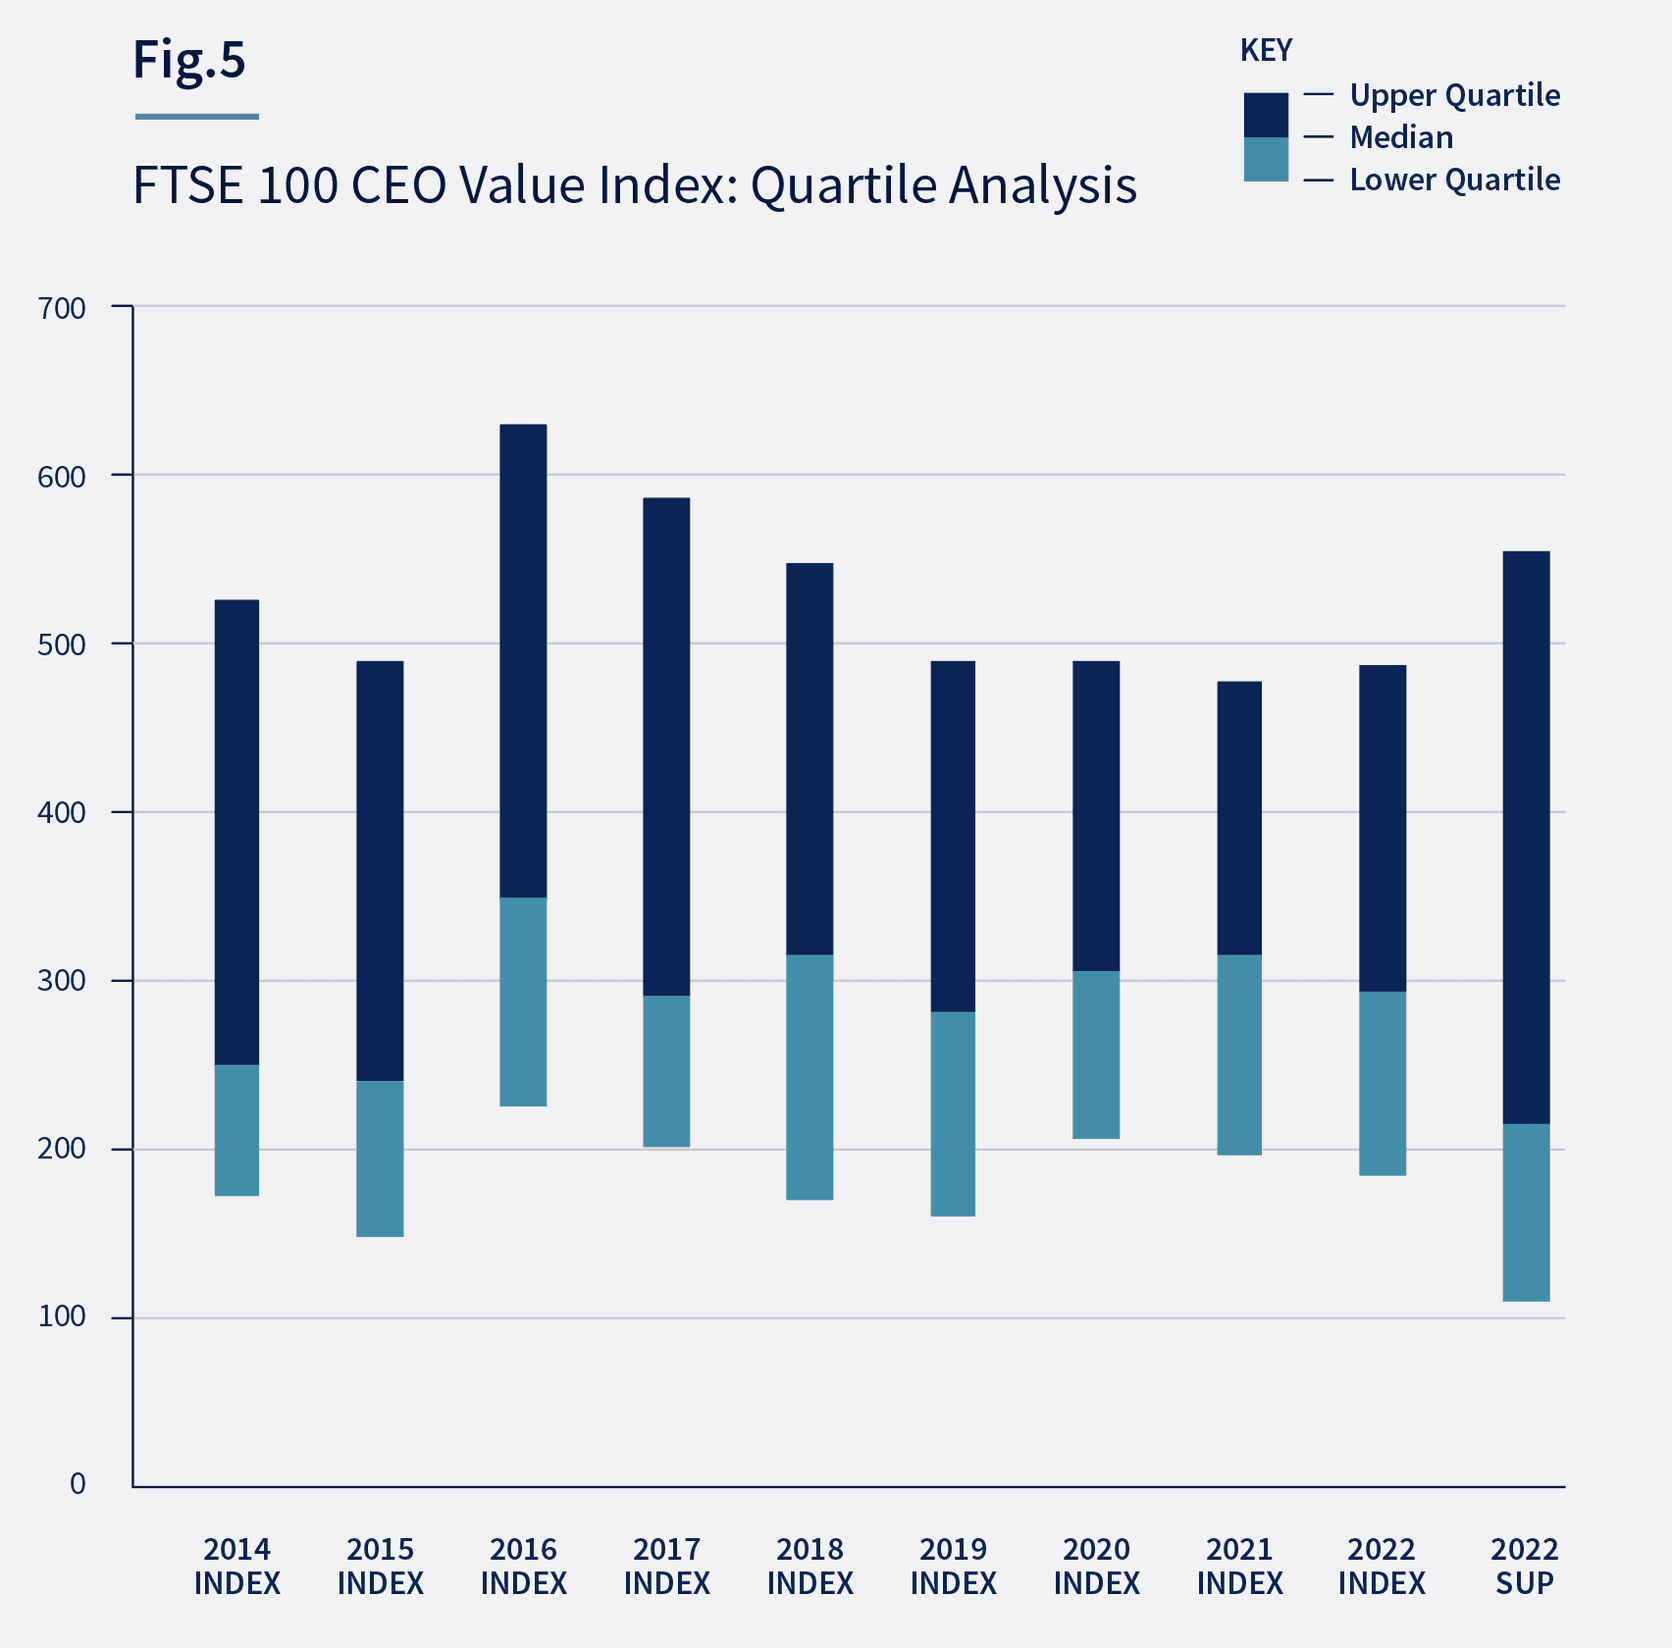
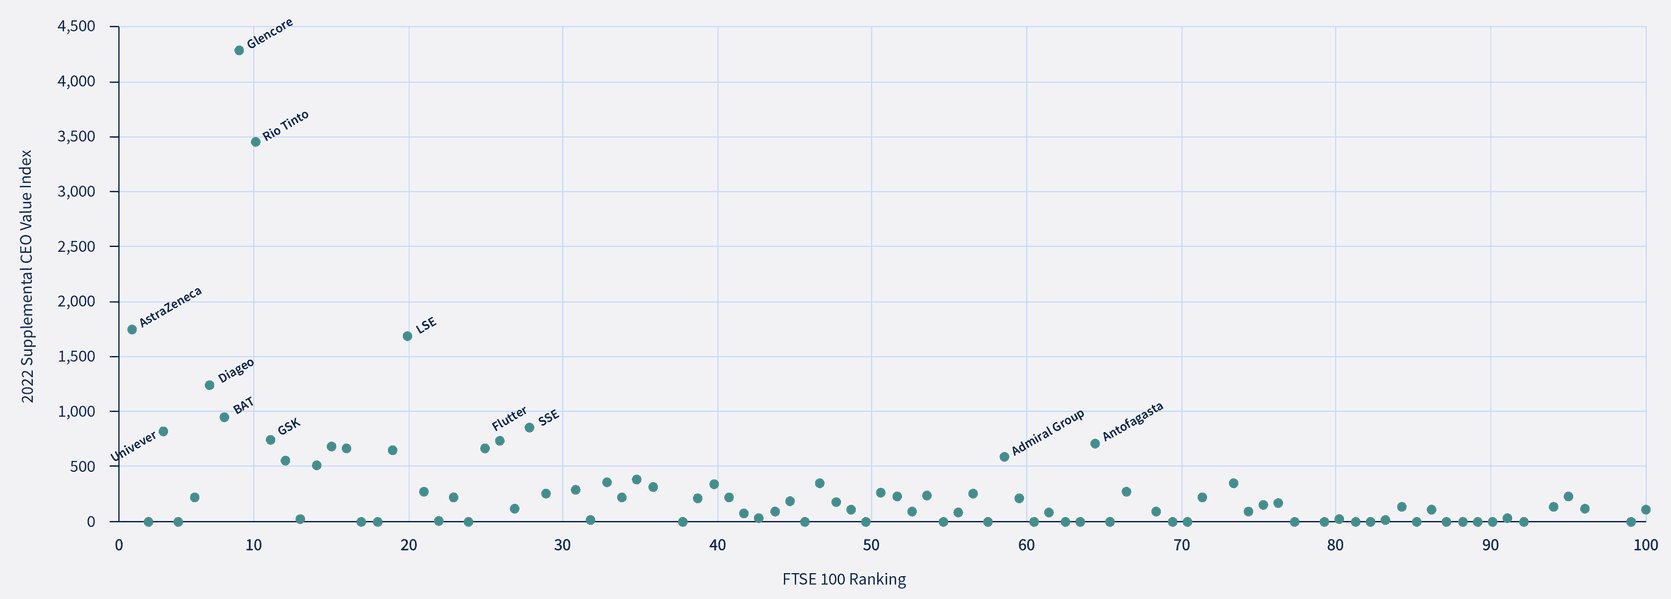
The supplemental Index has shown an interesting result. Whereas the 2022 decreased at the top and the mid-pack companies performed well [Fig. 4], the Supplemental Index is similar to the 2020 Index with a few companies scoring highly but the remaining Index are lower overall. The 2022 Index also shows a much larger spread of values with a lower median value than we have seen since 2019.
Summary: Overview of 2022 Supplemental CEO Value Index by FTSE Rank
Summary of our findings
The ‘winners’, in terms of the value added per £1 of remuneration, tend to be the largest companies
The 10 top companies in the CEO Value Index rankings are all within the FTSE30 and 7 out of the FTSE10. The 3 notable exceptions from the FTSE10 companies, are those with negative or low Value Added over the 4 year period (Shell, BP and HSBC).
This reflects a reality that the CEO of any very large company must guide ‘the ship’ across four years of far from plain sailing, but when that large ship does arrive…it often unloads considerably more Total Value Added than smaller peers. Hence, Index values tend to be more favourable, reflecting the realities of running a large vs a small enterprise
The Index shows remarkable consistency (see page 6) – allowing Remuneration Committee Chairs to calibrate programmes over time, between sectors and between companies of differing sizes…
…but in the 2022 supplemental Index, the collective performance of all companies - in terms of ‘value for money’ as indicated by the Index - has slipped back, overall. That is not a positive story, and shows how executive may have bounced back too far in the euphoria of a clearing economic weather pattern.
The cost of a CEO does not tell us whether they are good value – looking at Value Add against Remuneration over the 4 year period…
The largest cluster of companies added a relatively small amount of value and paid out relatively low pay.
A significant number of outliers paid out large remuneration but added little value.

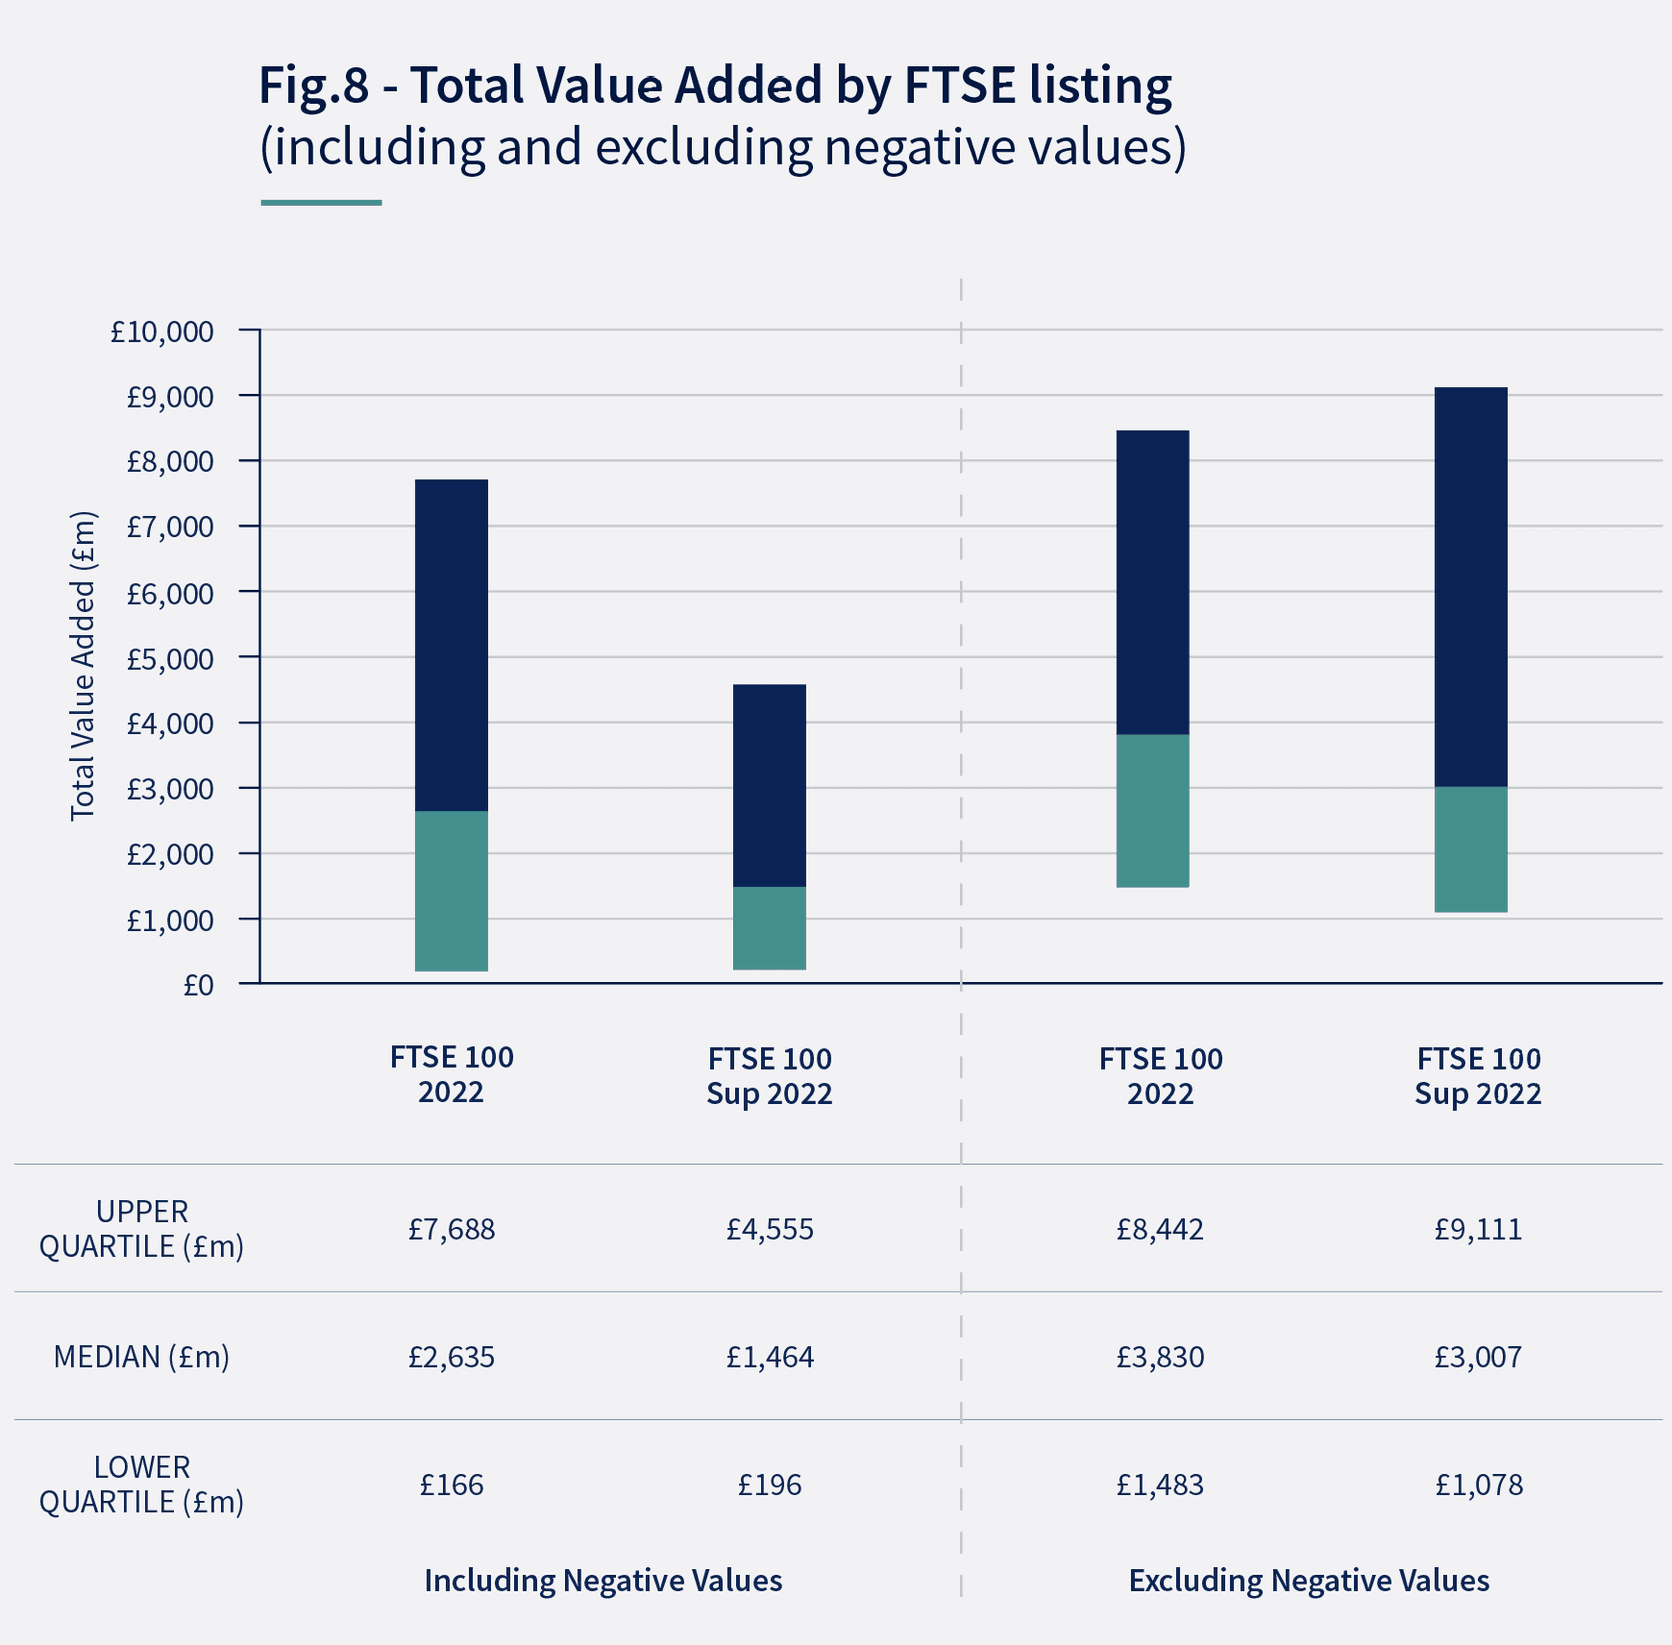
Change in Median total value added for FTSE100 companies
The below graph demonstrates the impact of the negative Value Add amongst the FTSE100 in the 4 year period ending Q4 2022 which is roughly half that found in the 2022 Index.
DOWNLOAD THE SUPPLEMENTAL CEO VALUE INDEX
