
The ‘Noddy Guide’ to Executive Compensation Plans
Rem.n's UK CEO Value Index, the simple ‘rule-of-thumb’ used to guide remuneration decisions, measures how much value an executive adds to the shareholders for every pound paid in CEO remuneration. This focus on the value not the cost of executives has produced many insights over the years:
- Changing a CEO is often better value for money to the shareholders than sticking with the incumbent;
- CEOs of mid-sized companies are often poor value for money;
- Female remuneration committee chairs are responsible for their companies delivering more value to the shareholder for every £1 paid the CEO than their male counterparts; and
- The fact that 70% of new CEO appointments in the FTSE 100 in the last five years have been promoted from within the business, and those 70 have added 40% more value to shareholders for every pound they were paid.
These are important insights because they have immediate implications for pay policy. For example, remuneration chairs should be less nervous about losing that expensive CEO.
But the research also takes us into potentially new and as yet uncharted areas. One particular area is that of incentive compensation plan design. Wouldn’t it be interesting to discover, for example, whether expensive ‘tailored’ designs were any better than their off-the-shelf equivalent? If they weren’t, it begs the question: what is the point of all those remuneration committee meetings, hours of independent advice, nerve-wracking shareholder votes, and pages and pages of director’s remuneration reports?
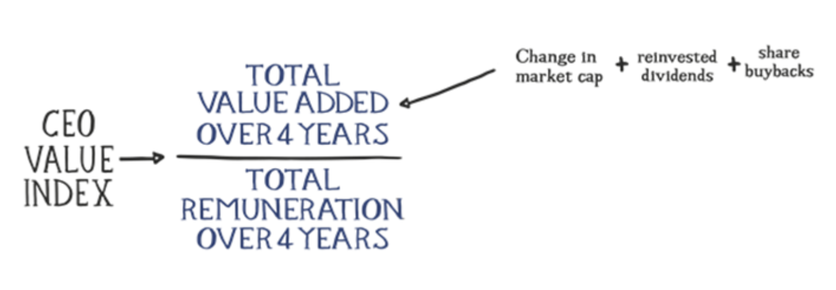
The Index uses a simple two component methodology:
- Total Value Added to shareholders by the company over the four years prior to June 30th in the current year. The calculation comprises the change in market capitalisation, dividends, and share buybacks.
- Total Remuneration paid to the CEO over the same four-year period.
We set about answering this question by looking at each company’s pay design to find the ‘noddy’ programmes, and then we looked at the outcome of every pay programme to see how many were simply ‘mediocre’.
What is this year’s ‘Noddy Plan’?
- Median salary;
- Annual bonus 1x to a maximum of 2x salary; and
- An annual grant of long-term incentives vesting in three years, tied to total shareholder returns (TSR).
Of a sample of 230 companies from within the FTSE 350 (we exclude trusts, funds, and REITs), 80 companies have exactly the executive pay design plan described above—the Noddy Plan.
In fact, these programmes have many other remarkable similarities as well (same bonus performance metrics, and so forth), but let’s keep the analysis simple for now.
Remuneration committees are choosing off-the-shelf because they perceive the risks of trying something tailored to the company, something new, far too great.
They have good reason to be afraid: the shareholder advisory firms and proxy advisors are on the war path. In 2011, institutional investors owned approximately 60 percent of publicly traded equities—it was 20 percent in the 1960s. Studies show that when the proxy voting agency ISS, the Pied Piper of the executive pay world, issues a negative recommendation, management-sponsored proposals have up to twenty percent fewer votes, individual directors receive fourteen to nineteen percent fewer votes, and say-on-pay proposals receive twenty-four percent fewer votes. A survey of 110 U.S. corporations found that seventy percent altered their executive compensation plans in response to proxy advisor input.
We then analysed those 80 companies who have chosen to incentivise their management using an off-the-shelf (or ‘noddy’) pay plan and compared them with the companies with more tailored programmes.
Once again, we used data captured during our 2017 CEO Value Index research to compare and contrast the productivity of a Noddy Plan versus tailored plans:
Companies using the Noddy Plan:
- Delivered 15% less value added to shareholders (at median, 41% less at upper quartile);
- Paid 20% less (at median, 23% at upper quartile); and
- Had a CEO Value Index 15% lower (at median, 6% lower at upper quartile).
While the Noddy Plan is easier to install and pays the CEO less—and is therefore an easier headline for remuneration committees to deal with—it actually delivers a CEO Value Index outcome (shareholder value added for all shareholders per £1 paid to the CEO) which is 15% worse, on average.
Does this matter? We think so.
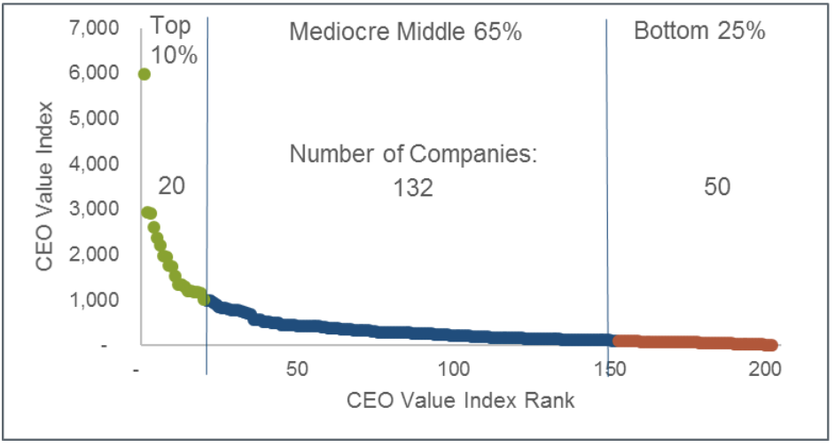
Separately, we analysed the companies in our CEO Value Index database to separate out, by Index value:
A. The top 10%: 20 companies in our sample;
B. The middle 65% of companies; and
C. The bottom 25%.
When we look at those buckets, there are a number of startling findings:
- 75% of all companies deliver less than £400 to all shareholders for every £1 paid in realised CEO remuneration;
- The successful pay programmes—the top 10%—ranges from £1,199 (at the lower quartile [LQ]) to £2,261 (at the upper quartile [UQ]) delivered to all shareholders for each £1 of CEO pay; and
- The bottom 25% delivers £48 (LQ) to £86 (UQ) to all shareholders for each £1 of CEO pay.
You did not read that incorrectly. The CEO of a company in the bottom twenty five percent of our sample of major UK companies will, by this measure, give all of the shareholders roughly one takeaway meal to share between all of them for every £1 he or she is paid.
To show how pay within the ‘mediocre middle’ companies defy gravity on executive pay, the chart below shows how average four-year total remuneration falls very gradually from the top 10% to the bottom 25% of companies while, in contrast, the market capitalisation and four-year value added falls away dramatically.
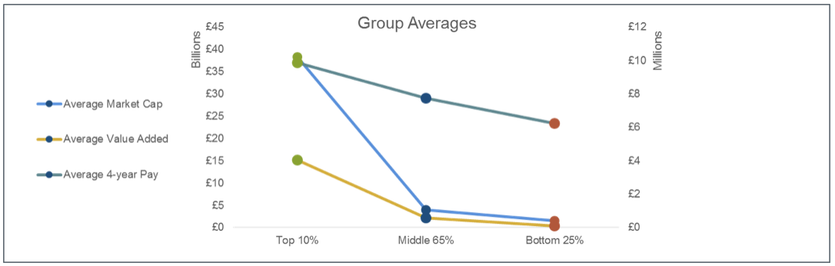
Some food for thought.
1 Median four-year Value Added to all shareholders: £1,415 v £1,202 (Noddy Plans) and upper quartile £4,360 v £2,586 (Noddy Plans)
2 Four-year total realised remuneration or ‘take home pay’: median £7.15m v £5.72m (Noddy Plans) and upper quartile £10.45m v £7.99m (Noddy Plans)
3 2017 CEO Value Index: median £227 v £194 (Noddy Plans) and upper quartile £448 v £422 (Noddy Plans)
4 171 ex 230 sample of companies (includes 16 with negative Value Added)